We no longer support this browser. Using a supported browser will provide a better experience.
Please update your browser.
The use of investment brokerage accounts has increased notably in recent years, broadening the population that is able to earn returns on wealth in the stock market and other financial assets. In the U.S., the percent of households with stock holdings increased to an all-time high of 58 percent as of 2022, according to the Federal Reserve’s Survey of Consumer Finances, up from 49 percent in 2013.1 Historically, use of brokerage accounts was more concentrated among those with higher incomes.2 However, within the past decade, our data show increasing engagement with investment accounts across the income spectrum. Notably, this engagement increased during a period in which the incomes of lower-income workers grew relatively quickly.
In this report, we use data from over 10 million active checking account users from 2007 to 2023.3 In recent years, about a quarter of our sample transferred significant funds to an external investment account.4 The data link households’ financial dynamics and investing transactions, enabling insight into the drivers underlying the rise in investing. We find that income growth—particularly when sustained over time—emerges as one of the strongest predictors of the investment transfers that we explore.
Our quantification of the connection between income changes and investing behavior allows policymakers to translate developments in the labor market or fiscal policy into the evolution of wealth inequality. For example, economic booms and tight labor markets have tended to result in outsized wage gains at the lower end of the income distribution. Asset prices tend to be relatively high when these economic conditions hold,5 implying that the timing of low-income individuals’ gains may put them at a disadvantage in terms of entering or adding to financial investments at attractive valuations.
We organize this report around three findings:
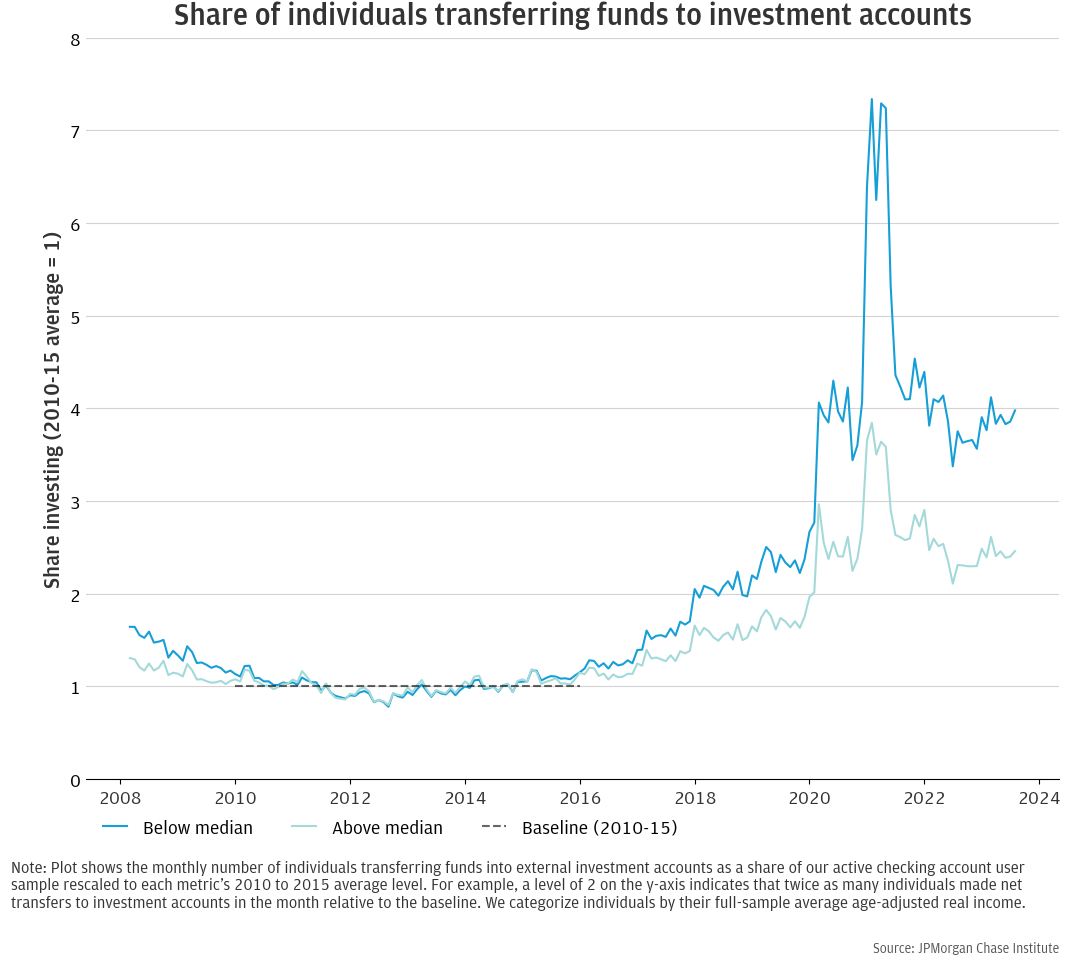
Figure 1 shows the share of individuals in our sample transferring funds from their checking account to investment accounts in monthly data from 2008 to 2023. The figure shows shares both for below- and above-median income individuals, and scales investor shares to each group’s baseline average over 2010 to 2015, a period when investing flows in our data stagnated in the wake of the Great Recession. As of 2023, the number of individuals making investing transfers in a given month was four times the 2010-15 baseline for those with below-median average incomes and two times for higher income individuals. Our income categorization method seeks to capture a person’s persistent earnings level—or likely “lifetime” real income—by ordering based on age-adjusted average earnings translated to 2023 dollars.6
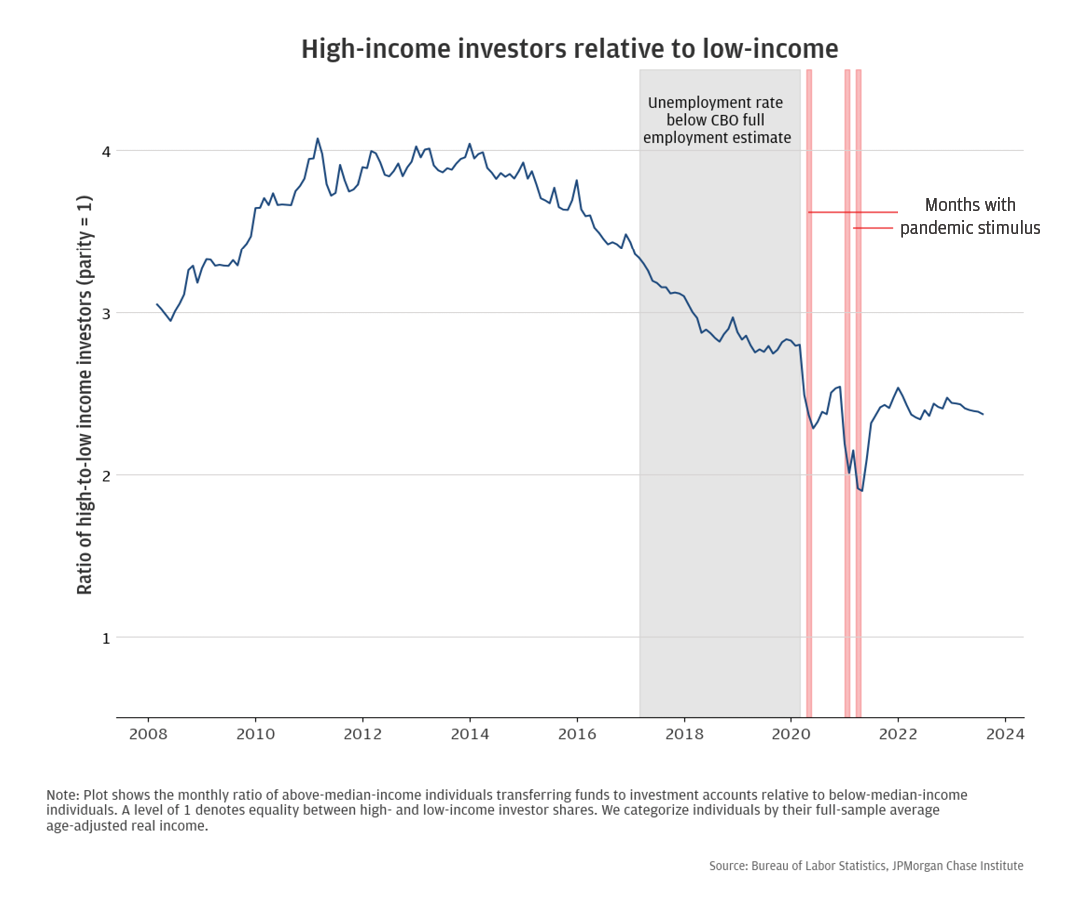
The second panel of Figure 1 provides a different perspective on the same trends by plotting the monthly ratio of above-median-income individuals making investing transfers to below-median-income. The imbalance fell from an average close to four-to-one in favor of those with high incomes, the rate prevailing from 2011 to 2014, to a low of two-to-one at the height of the 2021 stimulus-driven investing surge. Notably, incomes for low-wage workers grew substantially faster than those for high-wage workers during much of this period (Greig et al., 2021).7 Changes in the brokerage industry—including the availability of accounts with low (or no) minimum deposit amounts and reduced trading commissions—likely also contributed to the broadening base of investors.8
Figure 1: The share of investors with lower incomes rose steadily over the past decade—particularly during the pandemic savings surge.
Our data track changes in individual financial circumstances like income, spending, and cash balances—providing a unique lens on the drivers of individuals’ investment decisions. We find that income growth, savings, and cash buffers are substantial predictors of investing. Standard consumption-smoothing theory provides a basis for such relationships, as people save for the future (including in the form of financial market investments) when current income is elevated and liquidity on-hand is sufficient to support near-term spending. This micro-level observation—that people are more willing and able to invest when they are themselves experiencing increases in income and have near-term financial security—is a natural counterpart to the economy-wide perspective discussed in Finding 1.9
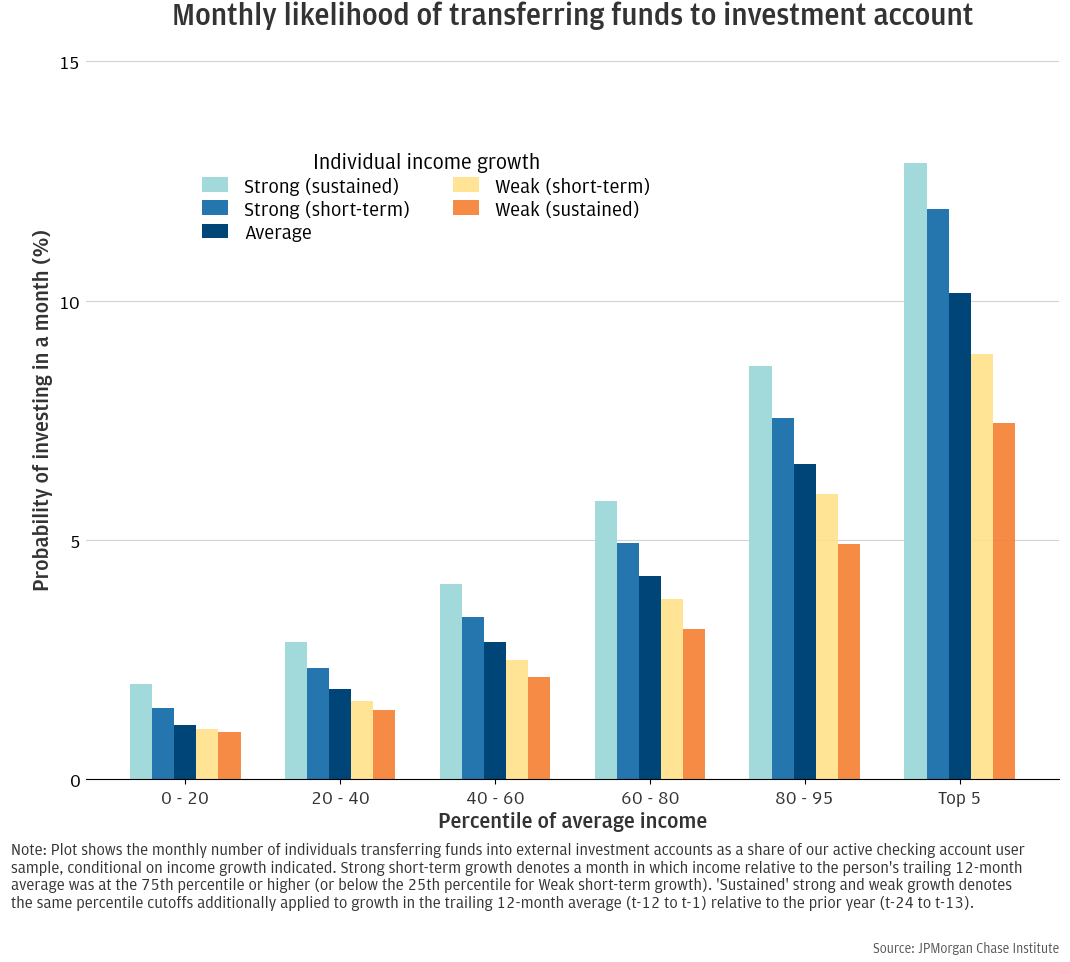
Figure 2 shows the monthly probability of transferring money to an investment account for individuals experiencing different income growth changes, for groups of different income levels. We summarize an individuals’ income growth dynamics two ways to capture potential differences in the timing of income changes and investment decisions. First, we compute a short-term measure of income growth as the current month’s income relative to the average of the prior 12 months.10 In the second way, we compute a longer-term measure of income growth as the 12 months trailing average income compared to the year prior.11 The plot shows outcomes by strong and weak growth, with strong denoting growth above the 75th percentile and below the 25th percentile, respectively, for both growth measures. We define “sustained growth” as cases in which both short- and long-term growth are strong or weak.
Both short- and long-term growth shift the likelihood of investing. In our full sample, the probability of investing in a month for an individual near median income—between the 40th to 60th percentiles—is 2.9 percent. A month of strong income growth increases the probability by almost 20 percent (half a percentage point) to 3.4 percent. Strong short- and long-term growth together lift the probability to 4.1 percent, over 40 percent higher than the average for individuals near the middle of the income distribution.
Income changes may take time to influence an individual’s financial position sufficiently to spur an investment decision, which helps explain the distinct roles for each income measure. Individuals may build additional liquidity (or reduce debts) before transferring funds to external investments. Standard household financial theory predicts such an influence of balance sheets on savings and decisions to invest.12 We explore the independent roles of short- and long-term income growth further in the Appendix: Statistical framework mapping individual-level financial circumstances to investing , which additionally considers cash liquidity and spending dynamics. Liquidity emerges as an important additional factor to consider. Individuals that have already transferred money to investment accounts appear to use them as an outlet for excess liquidity—investing when cash buffers (measured by liquid balances relative to spending) are elevated relative to their previous average level.
Figure 2: Income dynamics predict transfers to investment accounts.
The U.S. stock market and economy exhibit cyclical fluctuations. Academic research finds that the investment performance households can expect from the stock market is correlated with the economic cycle.13 When the economy is weak, expected future returns tend to be elevated (because current prices are depressed) and vice versa. Disparities in how booms and busts affect the population, therefore, may spill over into unequal investment returns. In particular, lower-income households may be at a disadvantage in the accumulation of financial market wealth because they tend to experience relative income gains—and have investable wealth—when economic expansions are already well underway and stock prices have already risen.14
To estimate disparities in the prices in which individuals purchase stocks, we use an indicator of stock market valuation over time and our data on investment transactions to compute average entry valuations of investments. Using valuation instead of simple prices helps put investments made at different points in time on a more “level playing field,” as common bases for investments—corporate earnings and dividends—rise over time. Our preferred measure weights purchases by individual investment decisions (defined as a month of significant net transfers to investment accounts), providing a “count-weighted” perspective. We supplement this measure with a dollar-weighted equivalent.15 The box: How we compute average purchase valuations provides further details.
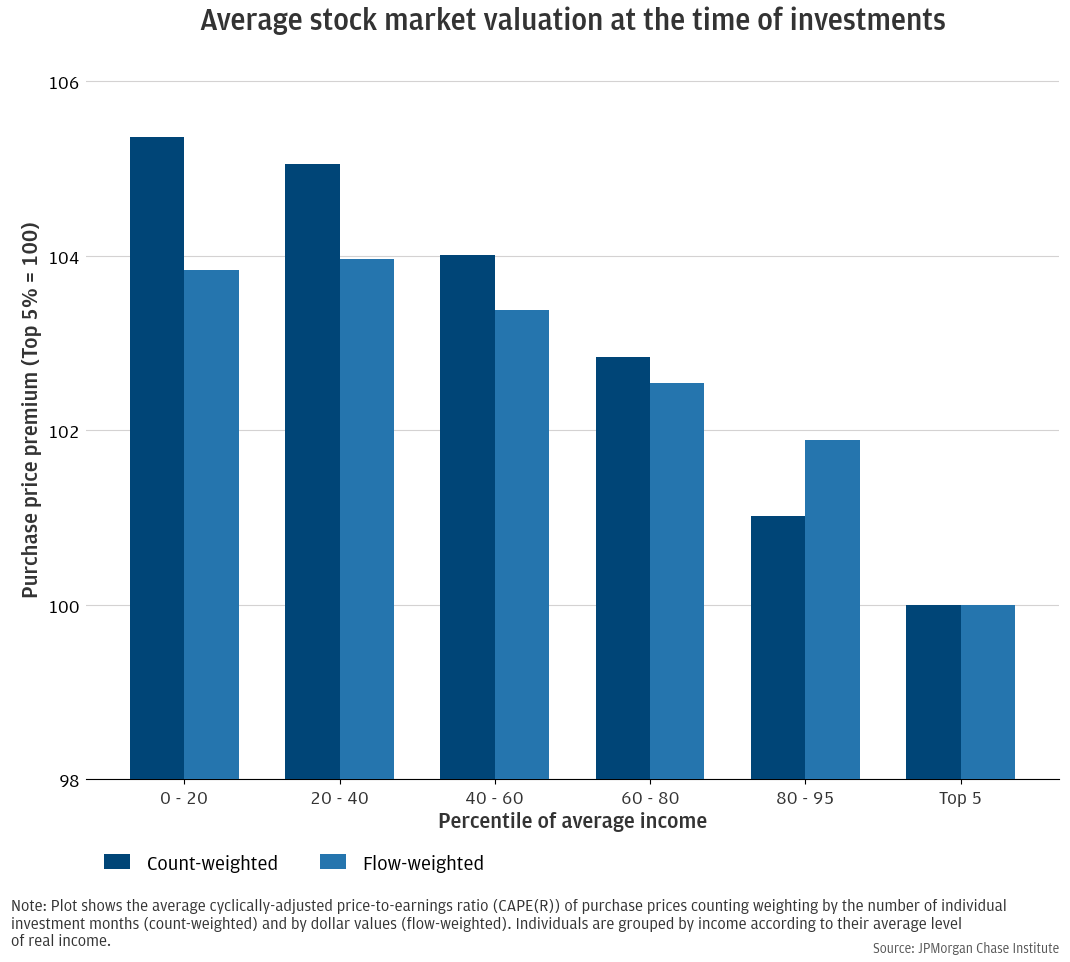
Figure 3 shows average purchase valuations, scaled to those of the top 5 percent earners—the group with the lowest, most attractive entry prices. The bottom two quintiles have the highest purchase prices, about 4 to 6 percent higher than the top earner group, depending on whether transaction- or dollar-weighting purchases. Computing the average purchase valuations by transactions (counts) shows a wider gap than dollar-weighting (flows), which could be consistent with the general relationship if some high-income individuals that invest more are mis-categorized as low-income if they receive some of their earnings through accounts at other financial institutions. Average purchase valuations decline steadily with from the 40th to the top percentiles, suggesting a positive relationship between expected investment returns and income level.
Figure 3: Lower income groups have made purchases when the stock market has been at relatively elevated valuations, on average, from 2008 to 2023.
How we estimate average stock market purchase pricing
To estimate the relative attractiveness of investments made by individuals across the income distribution, we compute flow-weighted averages of investment purchase prices by income group.16 Assets in retail investment accounts tend to track the stock market overall. Since corporate fundamentals like earnings—which drive expected future returns—usually increase over time, we use a metric that normalizes prices by a 10-year trailing average of earnings, as proposed in Shiller (2000).17 The use of a 10-year average of inflation-adjusted corporate earnings reduces the effects of short-term earnings volatility related to the state of the business cycle that may not reflect sustainable fundamentals. These adjustments help make investment flows more comparable over time in terms of expected returns for investors.
Specifically, for each income group, g, the two weighted-average purchase valuations are defined as follows, where t denotes month, S denotes the share of individuals in the sample making investments, f denotes the dollar value of transfers to investment accounts, and V is the valuation metric (CAPE®):

As a robustness check, we also check average purchase prices using raw prices over the shorter time horizon of 2017 to 2023 and find a larger, steeper declining relationship between purchase valuations and income.
Retail investing broadened notably across the population from 2016 through 2021 and remained higher as of last year compared to pre-pandemic levels. On a percentage basis, the increase in the number of investors with average incomes below the median was about twice as large than those with higher incomes. The trends, including higher-frequency changes during the pandemic, align with dynamics observed in income growth rates and the timing of fiscal stimulus payments. Using individual-level financial dynamics, we find that income growth is a strong predictor of transferring money to investment accounts.18 The signals from our data point to income dynamics as a central driver of financial wealth accumulation.
The broadening of the population engaging with financial markets is generally a positive sign for the reduction of stark wealth gaps. However, the timing of asset accumulation along the economic cycle provides some reason for caution. Over the period in which we observe rising investment flows of lower-income individuals, the stock market more than doubled. Notwithstanding gains for all individuals as markets have reached all-time highs (as of early 2024), relative returns have still favored those with higher incomes, echoing dynamics documented in Institute research on crypto-assets.19
Implications
The close connection between income gains and investing we discuss in this report suggests policymakers concerned with wealth inequality should consider how financial asset prices evolve alongside the labor market. In particular, our research carries implications for the Federal Reserve’s incorporation of distributional outcomes in its policymaking framework—laid out in 2019—which emphasizes benefits of tight labor markets for reducing inequalities. The reduction in unemployment prior to COVID-19 indeed appeared to tilt income growth and asset accumulation in favor of those with on the margin of the job market, largely those with lower incomes.
However, the evolution of asset prices also influences the trajectory of economic inequalities, and systematic connections between the financial cycle and the labor market cycle may carry unintended consequences for policymakers. Academic and industry research on financial markets has drawn clear links between asset market valuation and the economic cycle.20 Asset prices tend to be high during booms when, disproportionately, those with lower incomes are trying to gain sustainable footholds on the wealth ladder, in part by making financial investments. Policymakers at modern central banks regularly balance difficult tradeoffs. Indeed, this report points to challenges—emanating from how households accumulate investments—that may complicate policy that targets distributional labor market outcomes.
Statistical framework mapping individual-level financial circumstances to investing
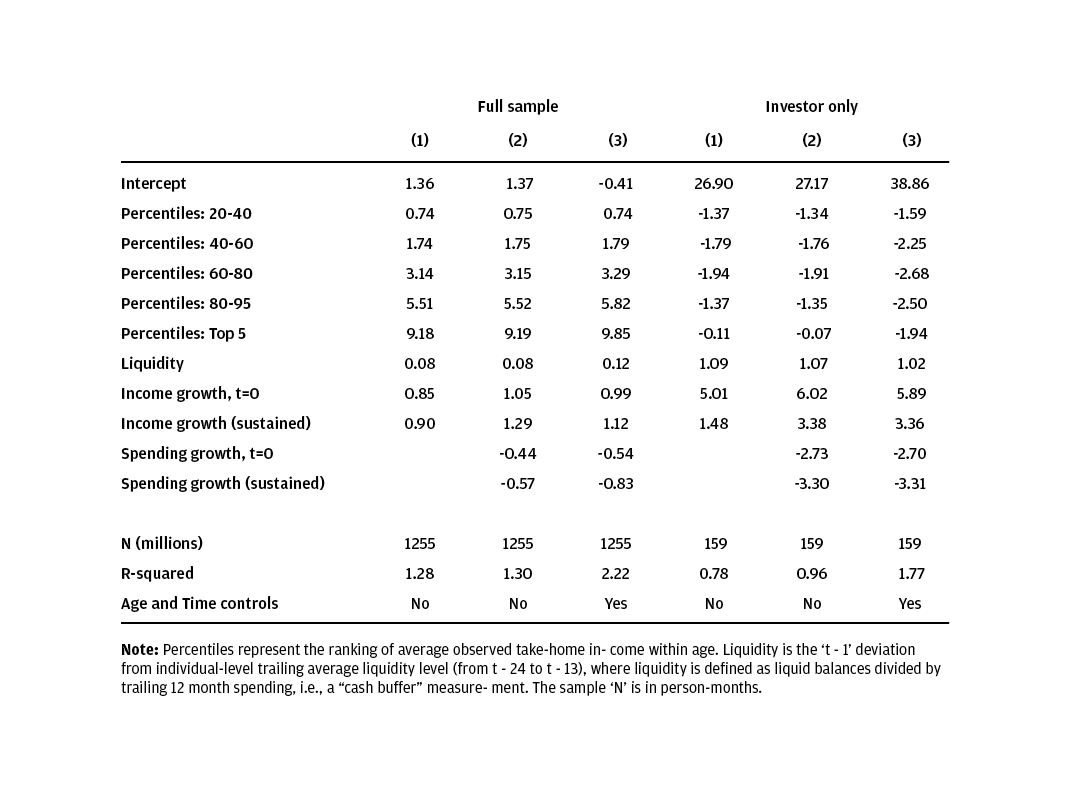
To better understand the links between income growth—as emphasized in this piece—and potentially other financial factors, like a person’s liquid cash buffer, we use the regression framework described below. Predictors of investment transfers tested here include a person’s average income level, recent income growth, cash buffers (defined as cash liquidity divided by average monthly spending, relative to an individual-level baseline), and other controls. Figure A.1 shows the regression results broken out by three specifications across two samples: the full sample and a separate, “investor only” sample, which includes data of individuals with at least one prior investment transfer. The same methodology for income growth—both “short-term” and “sustained”—used in Finding 2 apply here and are additionally applied to expense growth, to incorporate a potential role for savings.
The simplest specification—Model 1—includes income growth (both short-term and sustained) cash buffer (deviation in t-1 from the average over the t-24 to t-13 baseline) in addition to month fixed effects to capture seasonality. In the full sample, the estimates imply a one standard deviation increase in income growth, in a single month, increases the likelihood of a transfer to investments in that month by about 15 percent. Given that investment transfers are infrequent (i.e., 3 percent of the more than 1 billion person-months in the data), this amounts to just a 0.5 percentage point increase in the predicted probability of investing in the month.21 Sustained income growth adds another 0.4 percentage point increase in the probability, bringing the increase in likelihood of investing from 1-standard deviation of both short-term and sustained income growth to 28 percent. The role of income growth in predicting investment behavior is notably stronger when expense growth is low relative to income growth—that is, when an individual’s savings rate is increasing—which is shown in Models 2 and 3, which include measures of growth in account outflows excluding transfers, a proxy for spending. Model 3 includes the variables in Model 2 plus age and time controls. These do not notably affect the coefficients of interest.
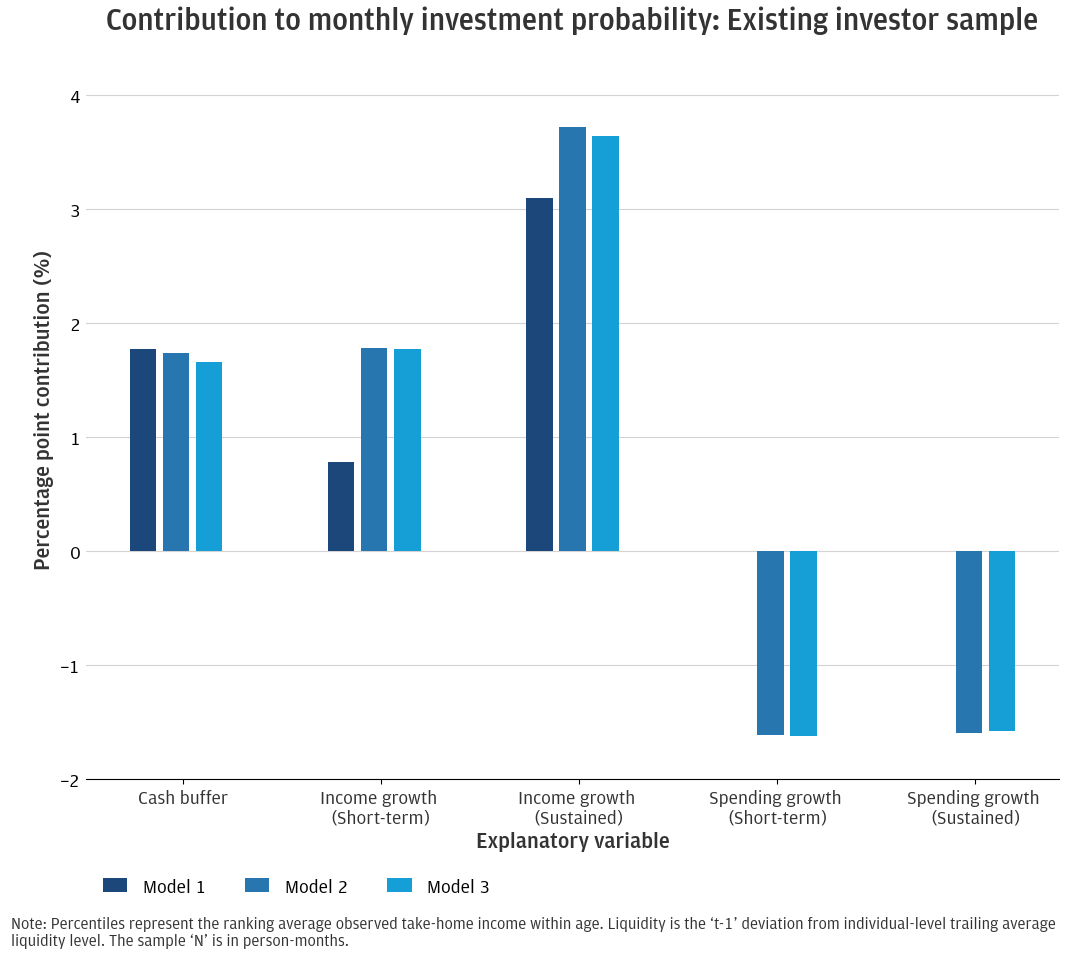
The empirical relevance of income growth, saving, and cash buffers is several times stronger in terms of percentage point contributions to investment likelihood when limiting the sample to individuals that have at least one prior investing transfer—i.e., after removing the individuals that are unlikely to become investors, for any reason. For example, in Model 1, the combined effects of a one standard deviation increase in one month’s income, on top of a one-standard deviation increase in sustained growth is almost 4 percentage points (almost 10 times as large as the full sample effect). Additionally, cash buffer increases—which have limited explanatory power in the full sample—have a notable role among prior investors, who may use external accounts as an outlet for excess cash.
Figure A.1: Individual-level factors that explain investing transactions: Income level, income growth, savings, and liquidity.
Regression results: Monthly probability of transferring funds to investment account
While the variables selected for this analysis have statistical and economic significance, the regression R-squared values are still on the order of 1 to 2 percent. Future research should consider other factors that shape the decision to invest in any given month, potentially including behavioral and financial market factors.
Figure A.2: Among investors, the contributions of high liquid balances, income growth, and contained expense growth add substantially to predicting the timing of new investment transfers.
Ben-David, Itzhak, Elyas Fermand, Camelia M. Kuhnen, and Geng Li (2018). “Expectations uncertainty and household economic behavior.” No. w25336. National Bureau of Economic Research.
Cochrane, John H (2011). “Presidential Address: Discount Rates.” The Journal of Finance.
Shiller, Robert J. (2000). Irrational Exuberance. Princeton, NJ: Princeton University Press.
We thank our research team, specifically Melissa O’Brien, for their hard work and contribution to this research. Additionally, we thank Oscar Cruz, Annabel Jouard, and Robert Caldwell for their support. We are indebted to our internal partners and colleagues, who support delivery of our agenda in a myriad of ways, and acknowledge their contributions to each and all releases.
We would like to acknowledge Jamie Dimon, CEO of JPMorgan Chase & Co., for his vision and leadership in establishing the Institute and enabling the ongoing research agenda. We remain deeply grateful to Peter Scher, Vice Chairman, Tim Berry, Head of Corporate Responsibility, Heather Higginbottom, Head of Research, Policy, & Insights, and others across the firm for the resources and support to pioneer a new approach to contribute to global economic analysis and insight.
This material is a product of JPMorgan Chase Institute and is provided to you solely for general information purposes. Unless otherwise specifically stated, any views or opinions expressed herein are solely those of the authors listed and may differ from the views and opinions expressed by J.P. Morgan Securities LLC (JPMS) Research Department or other departments or divisions of JPMorgan Chase & Co. or its affiliates. This material is not a product of the Research Department of JPMS. Information has been obtained from sources believed to be reliable, but JPMorgan Chase & Co. or its affiliates and/or subsidiaries (collectively J.P. Morgan) do not warrant its completeness or accuracy. Opinions and estimates constitute our judgment as of the date of this material and are subject to change without notice. No representation or warranty should be made with regard to any computations, graphs, tables, diagrams or commentary in this material, which is provided for illustration/reference purposes only. The data relied on for this report are based on past transactions and may not be indicative of future results. J.P. Morgan assumes no duty to update any information in this material in the event that such information changes. The opinion herein should not be construed as an individual recommendation for any particular client and is not intended as advice or recommendations of particular securities, financial instruments, or strategies for a particular client. This material does not constitute a solicitation or offer in any jurisdiction where such a solicitation is unlawful.
Wheat, Chris, and George Eckerd. 2024. “The Rise in Retail Investing: Roles of the Economic Cycle and Income Growth.” JPMorgan Chase Institute. https://www.jpmorganchase.com/institute/research/financial-markets/the-rise-in-retail-investing-roles-of-the-economic-cycle-and-income-growth


JPMorgan Chase & Co.'s website terms, privacy and security policies don't apply to the site or app you're about to visit. Please review its website terms, privacy and security policies to see how they apply to you. JPMorgan Chase & Co. isn't responsible for (and doesn't provide) any products, services or content at this third-party site or app, except for products and services that explicitly carry the JPMorgan Chase & Co.