We no longer support this browser. Using a supported browser will provide a better experience.
Please update your browser.
For the past few years, household financial strength has underpinned a solid U.S. economic growth outlook. As we get further past the pandemic-era savings surge, consumption growth is increasingly aligning with real incomes. As shown in recent Institute Cash Pulse releases, cash outflows are closing in on inflows (slowing the decline in median balances), and smaller liquid buffers provide households with less wiggle room than any point since early 2020.
Varying perspectives on real income growth trends. With the outlook for demand ever more closely joined with pay—and questions about what could be driving a deficit of consumer confidence—a lot of attention has been dedicated to what’s going on with the purchasing power of incomes, i.e., real income growth. For such a fundamental economic concept, there is a surprising degree of heterogeneity in beliefs about the extent to which “incomes are keeping pace with price increases.” Maybe this is natural. After all, in the wake of the inflation peak in mid-2022, there was public debate about whether things were looking better due to discrepancies between year-on-year vs. month-on-month jibs and jabs in the time series, of a single indicator (although, to be fair, comparisons of core vs. headline et cetera were also complicating factors). Real income growth requires two time series (twice as hard!).
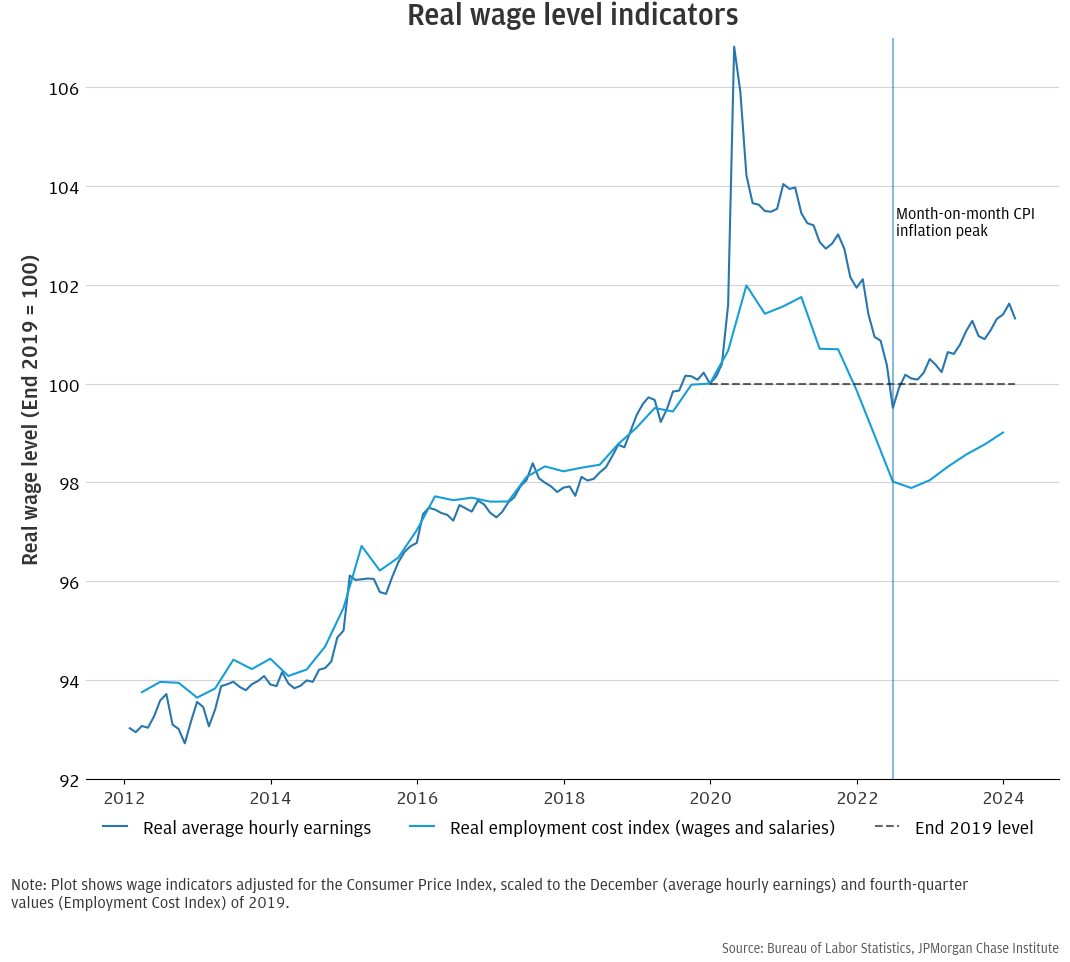
With that precedent, maybe it’s not surprising that there are a range of views as to how real income growth has been performing. Shorter time horizons are easier: over the past year, mainstream indicators point towards real income gains. But after the COVID-19-driven volatility in the labor market, fiscal stimulus, and inflation—it can be hard to know where exactly workers stand relative to a more stable benchmark predating the pandemic-era disturbances. Let’s focus on some objective indicators to ground ideas. Two government data releases on wages (note: the price of labor, not labor income, which would be wage * quantity) are Average Hourly Earnings (AHE) and the Employment Cost Index for Wages and Salaries (ECI). The former is released monthly and changes with the composition of jobs (a spike in AHE in early 2020 coincided with layoffs in lower-wage service jobs), while the latter is a “cleaner” measure of within-occupation compensation change released quarterly. The figure below shows the two nominal series after dividing by the Consumer Price Index and scaling to their end-of-2019 values.
Figure 1: Two measures of real wage trends (FRED plot link)
Oh dear … one series says we’re better off, the other says the opposite (comparing, as has become the norm, to a 2019 baseline). Confusing! Both series suggest that we’re below pre-pandemic trends, at least according to the eyeball and most reasonable picks for start/end points for extrapolation. ECI holds occupations constant, so there may be an upskilling story, i.e., perhaps the average worker has migrated up the value chain and is in a higher wage job, driving AHE higher but leaving the within-job ECI behind. We can’t tell directly without bringing in much more data, but a within-person perspective from earlier Institute analysis (discussed below) provides one lens.
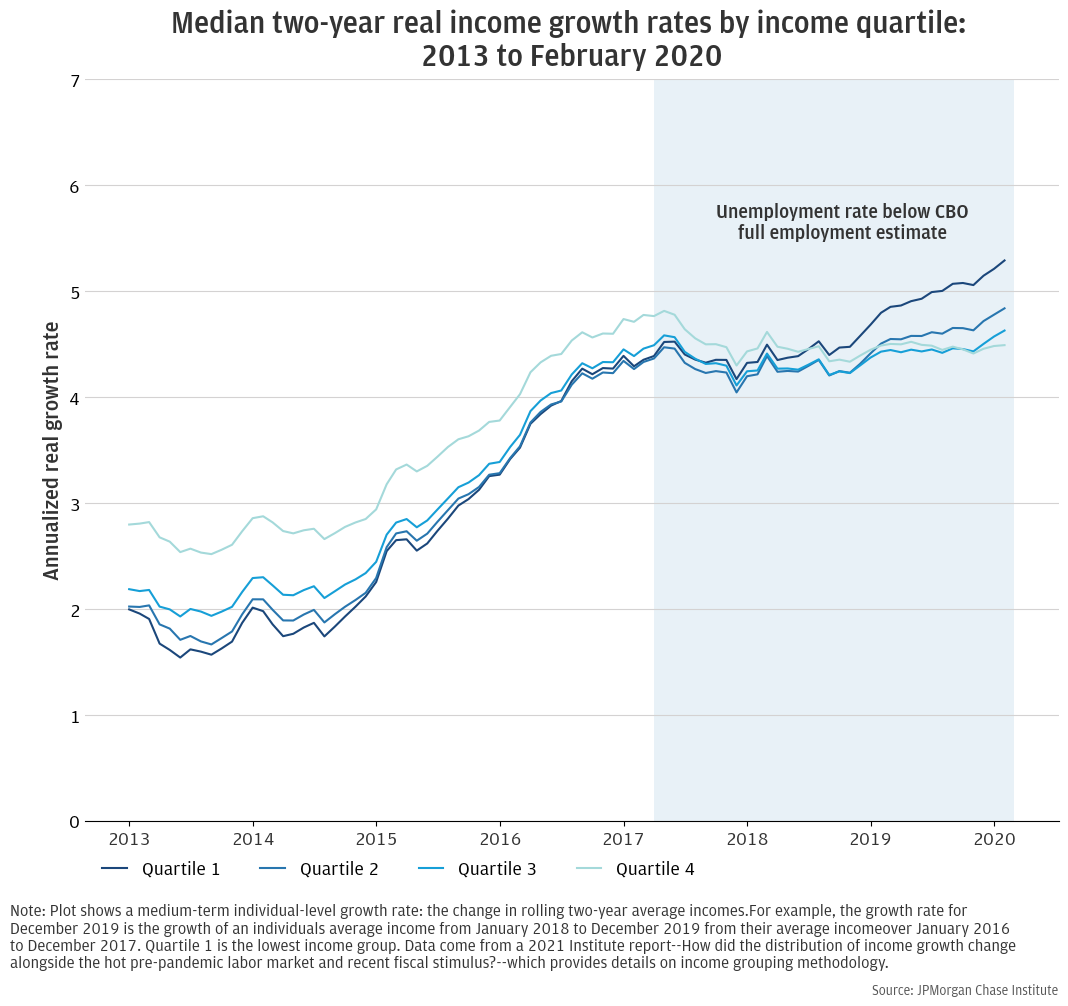
Squaring with JPMC within-person measures. An Institute report from a few years ago shows a similar story in the pre-pandemic era: lower growth prior to 2015, and then a pick-up as the labor market tightened lasting through 2019. Notably, the following two plots on income dynamics differ from usual publicly available sources in that they center on take-home pay and use a broad measure of income that includes inflows from government programs like Unemployment Insurance and Economic Impact Payments.
Figure 2: Pre-pandemic view on income growth shows lower-income groups benefitted most from labor market tightening.
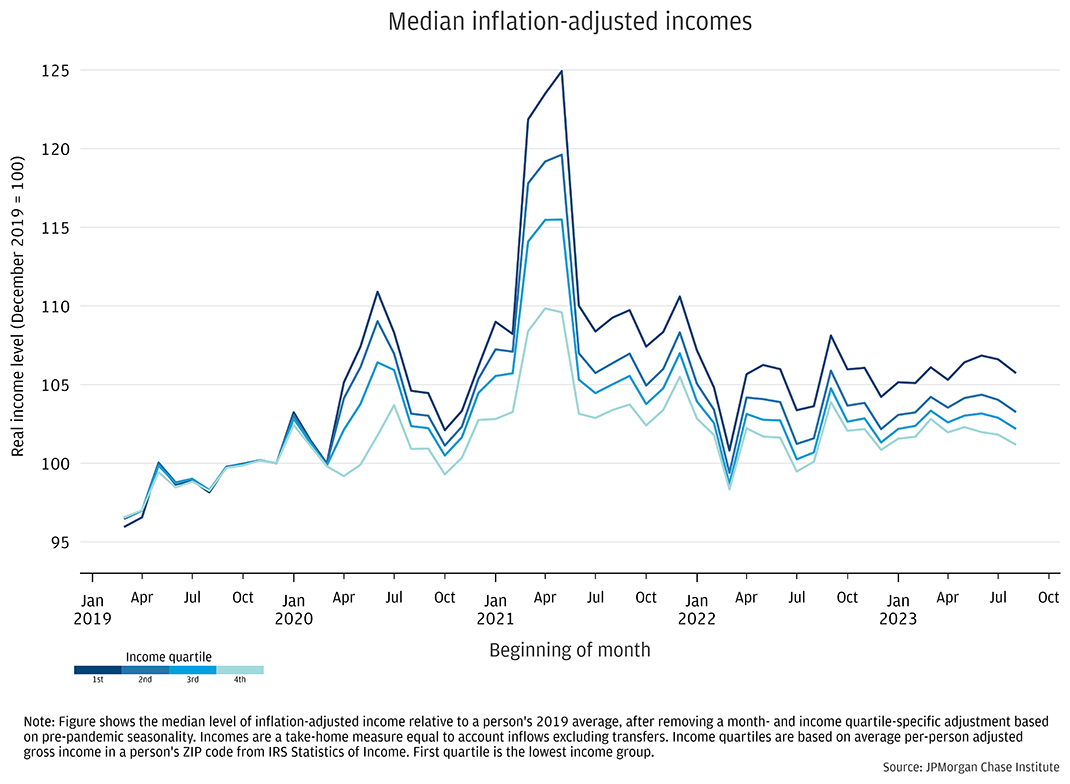
Our most recent Purchasing Power report provides a lens on “where we are now” (or at least as of August 2023) comparing individuals’ take-home income relative to their late 2019 level. Figure 3 shows that across income quartiles, folks have one-to-six percent higher real incomes than late 2019. Lower-income individuals are on the higher end of the range—a distributional outcome consistent with other recent research on this topic. Aggregating across about four years, this is an annualized growth rate difference of between 1 and 1.5 percentage points, roughly in-line with the growth differentials seen just before 2020. Interestingly, however, that separation had occurred as of late 2021: by the end of that year, the direct impact of fiscal stimulus on incomes had faded, but individuals with lower incomes had sustained their relative gains. Effectively, our data show no net progress in extending that trend over the last two years of the series, despite the unemployment rate remaining near its lowest level in over fifty years. Notably, the timing of relative income trends in our data does not align with the Atlanta Fed’s Wage Growth Tracker, which also provides a breakout by wage quartile. This is, in part, because those data use 12-month rolling averages of 12-month growth rates, due to sample size limitations in the underlying Current Population Survey Data.
Figure 3: Tracking individuals over time shows modest real income gains over four years, which translate to minimal growth after taking out the effect of aging.
Are our figures for 2019 to 2023 comparable to the BLS metrics? Kind of, but only after transformation along the following lines. The growth measure we’ve used in Institute reports is a within-person concept—which is great when you’re concerned with the experience of actual households—but it means we’re tracking a population that is getting older as we watch them walk-up their career ladder. Academic research implies that may bias upward our growth measure by over 1 percentage point per year for people in their early-to-mid-forties (close to our sample average) relative to labor-market-wide data. With the center of our growth distribution about three-to-four percent from 2019 to 2023, real income gains have been slower than prior periods, and—depending on expectations for life-cycle growth—might line up with the less-optimistic signal from ECI at about 99 percent of the December 2019 value.
While this isn’t a great outcome, wage gains netted across the past several Jobs Reports suggest growth exceeding inflation, despite the soft number for February, which may eventually make up for earlier inflation-adjusted losses.
This material is a product of JPMorgan Chase Institute and is provided to you solely for general information purposes. Unless otherwise specifically stated, any views or opinions expressed herein are solely those of the authors listed and may differ from the views and opinions expressed by J.P. Morgan Securities LLC (JPMS) Research Department or other departments or divisions of JPMorgan Chase & Co. or its affiliates. This material is not a product of the Research Department of JPMS. Information has been obtained from sources believed to be reliable, but JPMorgan Chase & Co. or its affiliates and/or subsidiaries (collectively J.P. Morgan) do not warrant its completeness or accuracy. Opinions and estimates constitute our judgment as of the date of this material and are subject to change without notice. No representation or warranty should be made with regard to any computations, graphs, tables, diagrams or commentary in this material, which is provided for illustration/reference purposes only. The data relied on for this report are based on past transactions and may not be indicative of future results. J.P. Morgan assumes no duty to update any information in this material in the event that such information changes. The opinion herein should not be construed as an individual recommendation for any particular client and is not intended as advice or recommendations of particular securities, financial instruments, or strategies for a particular client. This material does not constitute a solicitation or offer in any jurisdiction where such a solicitation is unlawful.
JPMorgan Chase & Co.'s website terms, privacy and security policies don't apply to the site or app you're about to visit. Please review its website terms, privacy and security policies to see how they apply to you. JPMorgan Chase & Co. isn't responsible for (and doesn't provide) any products, services or content at this third-party site or app, except for products and services that explicitly carry the JPMorgan Chase & Co.