We no longer support this browser. Using a supported browser will provide a better experience.
Please update your browser.
For a large majority of American households, tax season brings one of the most significant positive cash flow events of the year in the form of tax refunds. In our report Deferred Care: How Tax Refunds Enable Healthcare Spending, we described the impact of that event on out-of-pocket healthcare payments. We found that in 2016, a tax refund represented the single largest cash infusion of the year for 40 percent of our study sample; the average account balance grew by 42 percent on the day that the first tax refund was credited. In addition to their size, another important feature of tax refunds is that they are forecastable; by the time most filers complete their returns, they will know how much money to expect, though they generally will not know exactly when the money will arrive.
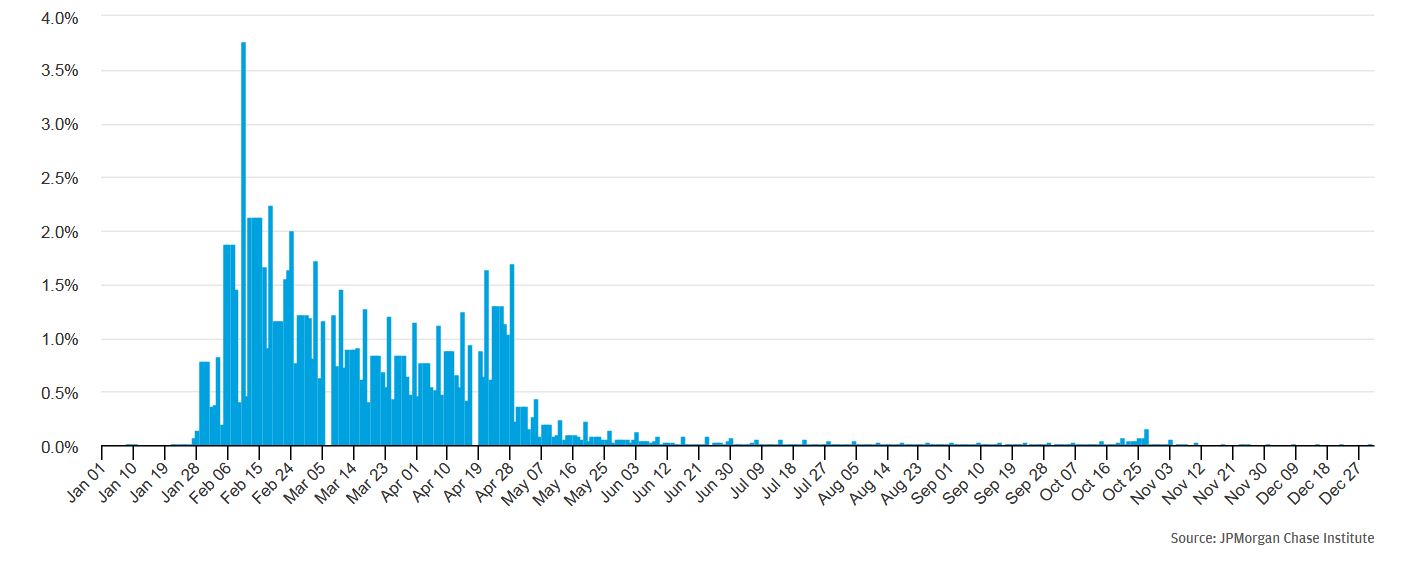
Even though tax filers cannot control or predict the exact day when their refund will be credited to their account, they can influence the timing on the order of weeks or months by filing earlier or later in the season. Variation in that behavior is reflected in Figure 1, which is reproduced from our Deferred Care report. It shows the distribution in the timing of tax refund payments in our study sample for the year 2016.1 Thirty-eight percent of our sample received their tax refund in February, 28 percent in March, 29 percent in April or May, and the rest (5.5 percent) outside of the typical season.
Leveraging data on 1.2 million accounts receiving tax refunds in 2016, we investigate variation in the timing of tax filing across socioeconomic and demographic groups, and variation in the impact of the tax refund on out-of-pocket healthcare spending.
Findings
Figure 1: Tax refund season typically runs from early February until the middle of May
Percent of tax refund payments that arrived each day in 2016
In this follow-up research to our Deferred Care report, we investigate variation in the timing of tax refund disbursements across socioeconomic and demographic groups, and variation in the impact of the tax refund on out-of-pocket healthcare spending. To our knowledge, this is the first analysis in 30 years to look at how the timing and size of tax refunds varies across a broad income distribution.2 We find that among filers who are owed a refund, lower income and younger people tend to file earlier in the season. Even within an income or age group, those who are owed larger refunds tend to file earlier. This pattern is consistent with the hypothesis that consumers have a sense of how much to expect, and those who expect larger refunds have an incentive to file earlier. Whether consciously or not, consumers behave as if they are using tax filing to generate a cash infusion.
Some of the cash from tax refunds goes toward catching up on deferred out-of-pocket healthcare spending. A major finding from our previous research is reproduced in Figure 2.3 Over the week after the first refund payment of the year, out-of-pocket healthcare spending is elevated on average by 60 percent; spending remains elevated for about 76 days by an average of 20 percent. Account holders begin spending immediately upon receiving their refunds, but not before — even though they generally know how much to expect before the refund arrives. We also found that 60 percent of the additional spending triggered by the tax refund is done in person at care providers’ offices. Since care paid for at the point where it is provided was also likely paid for at the time it was provided, we described this as “deferred care” — healthcare services which consumers would have received earlier, if the tax refund had arrived earlier. Almost all of the remaining 40 percent of the spending response comprised remote payments to service providers; we conservatively classified all of that spending as “deferred bill pay.”
Figure 2: Out-of-pocket healthcare spending spikes when a tax refund payment is received
We examine how the spending response to tax refunds varies across demographic and socioeconomic groups. We segment the study sample by age and gender of the primary account holder, estimated annual income, and — in light of our initial findings regarding variation in filing behavior — tax refund timing.4
We investigate responses to the tax refund in terms of overall out-of-pocket healthcare spending (which we shorthand to “overall spending”) and also spending on deferred care in particular.5 We focus on spending over the 76 days after receipt of the first tax refund credited to an account in 2016, and compare against a baseline which is the average rate of spending during the six months leading up to the refund.
We find that healthcare spending out of accounts held by early filers, younger people, women, and lower-income people increased by the largest proportion in response to the tax refund. In fact, we observe a steady income gradient — the spending response of each income quintile is stronger than that of the next higher quintile. Furthermore, deferred care represented a larger fraction of the spending response for earlier filers, women, and lower-income people. Notwithstanding the income gradient in the spending response, we find that cash flow dynamics affected the timing of out-of-pocket healthcare payments even among the higher-income quintiles. Finally, we find that regardless of income, those who filed earlier in the season put a larger fraction of their tax refunds toward deferred healthcare spending; therefore, the differences by tax refund timing are not simply a reflection of the fact that lower-income people are over-represented among the early filers.
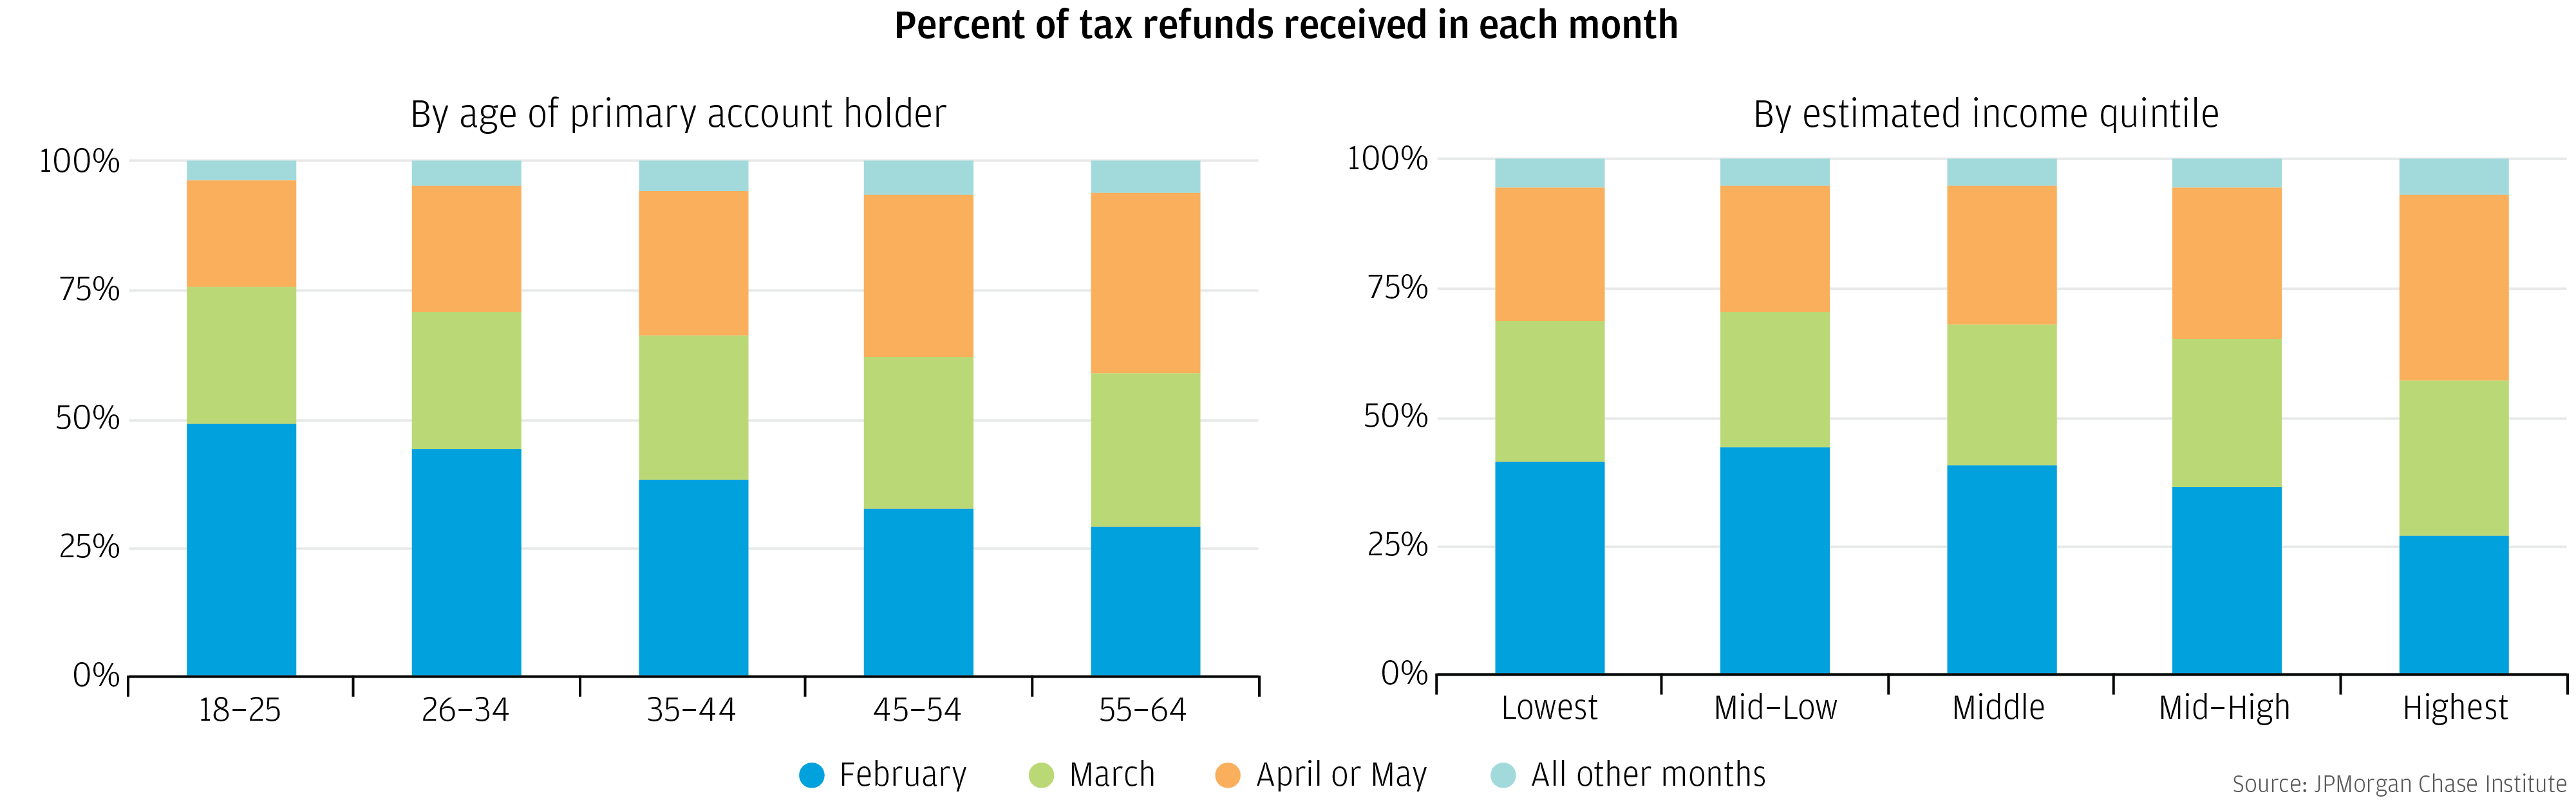
Tax refunds are a major cash flow event for most recipients. Do cash flow needs drive consumers’ tax filing behavior? In Figure 3, we show that tax refunds arrived earlier in the season into accounts that were held by younger people (left panel) and those with lower estimated income (right panel).6 The income gradient likely reflects two dynamics: first, lower-income consumers may have a greater need for a cash infusion and thus more incentive to file earlier in the year; second, a larger fraction of refunds paid to lower-income filers may be driven by refundable tax credits like the Earned Income Tax Credit. Refund dollars from refundable tax credits generally represent new income that could not have been accessed prior to tax filing season. By contrast, higher-income filers, whose refunds are driven more by payroll withholding, may have more scope to claim adjustments on their withholding in order to influence how much of their income is spread over the year and how much comes in their tax refund.
Figure 3: Younger and lower income account holders tended to file earlier
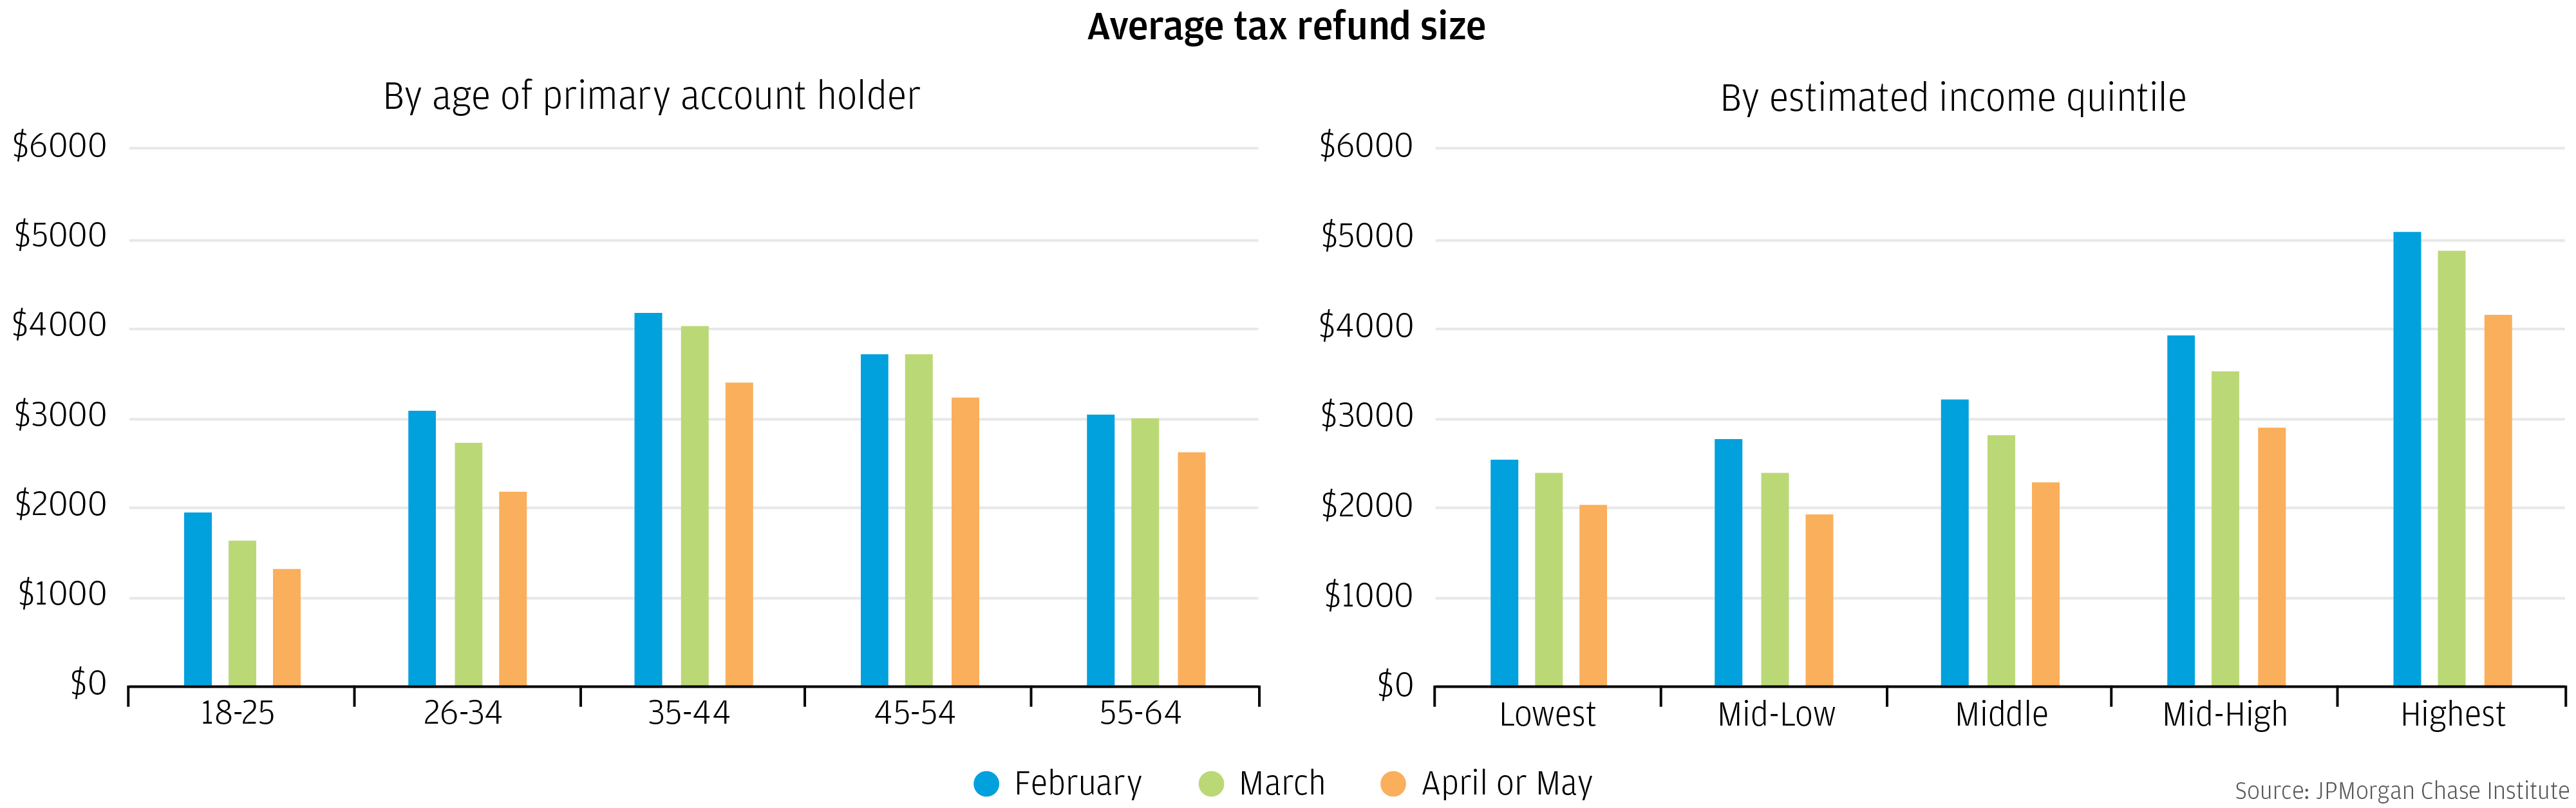
In Figure 4, we show that within an income or age group, those who were owed a larger refund tended to receive their refunds earlier in the season.7 This pattern is consistent with the hypothesis that consumers have a sense of how much to expect, and those who expect larger refunds have an incentive to file earlier in the season. The patterns in Figures 3 and 4 indicate that consumers for whom the tax refund is likely to have the biggest cash flow impact (those who are most likely to need a cash infusion and those who stand to receive the most cash) seek it by filing earlier in the year. This implies that — whether consciously or not — consumers use tax filing to generate a cash infusion.
Figure 4: Within each age and income group, those who are owed larger refunds file earlier
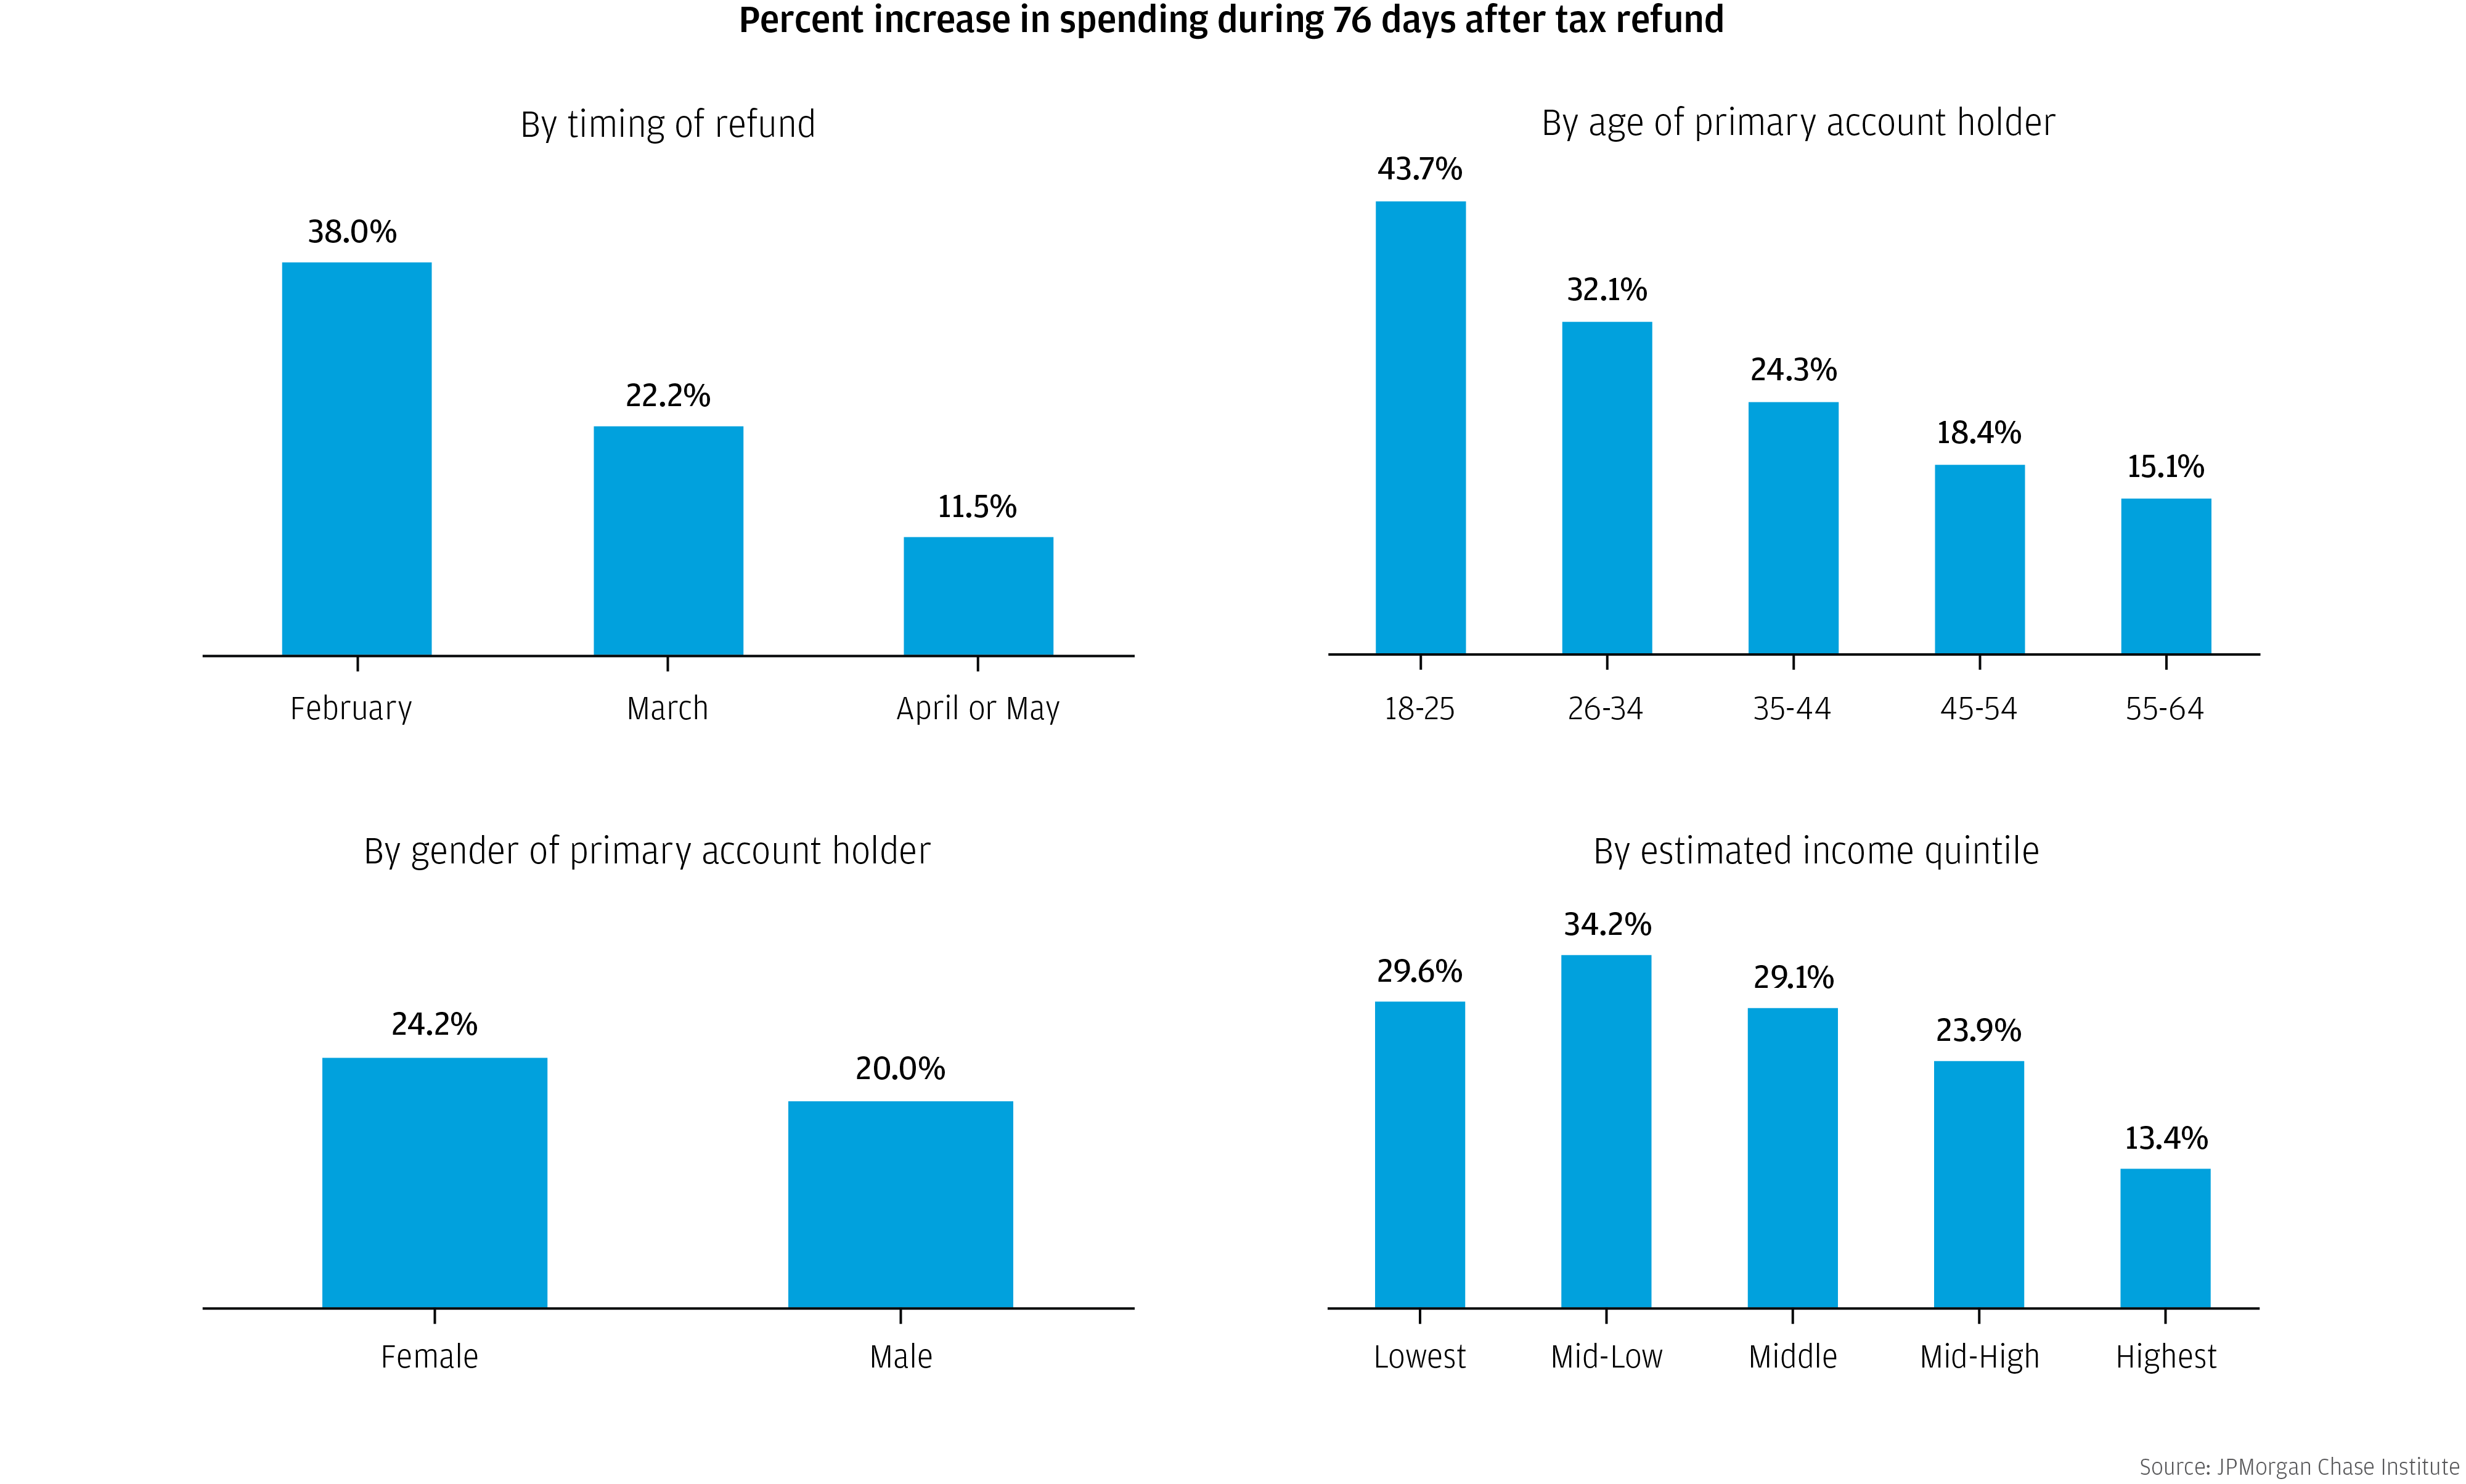
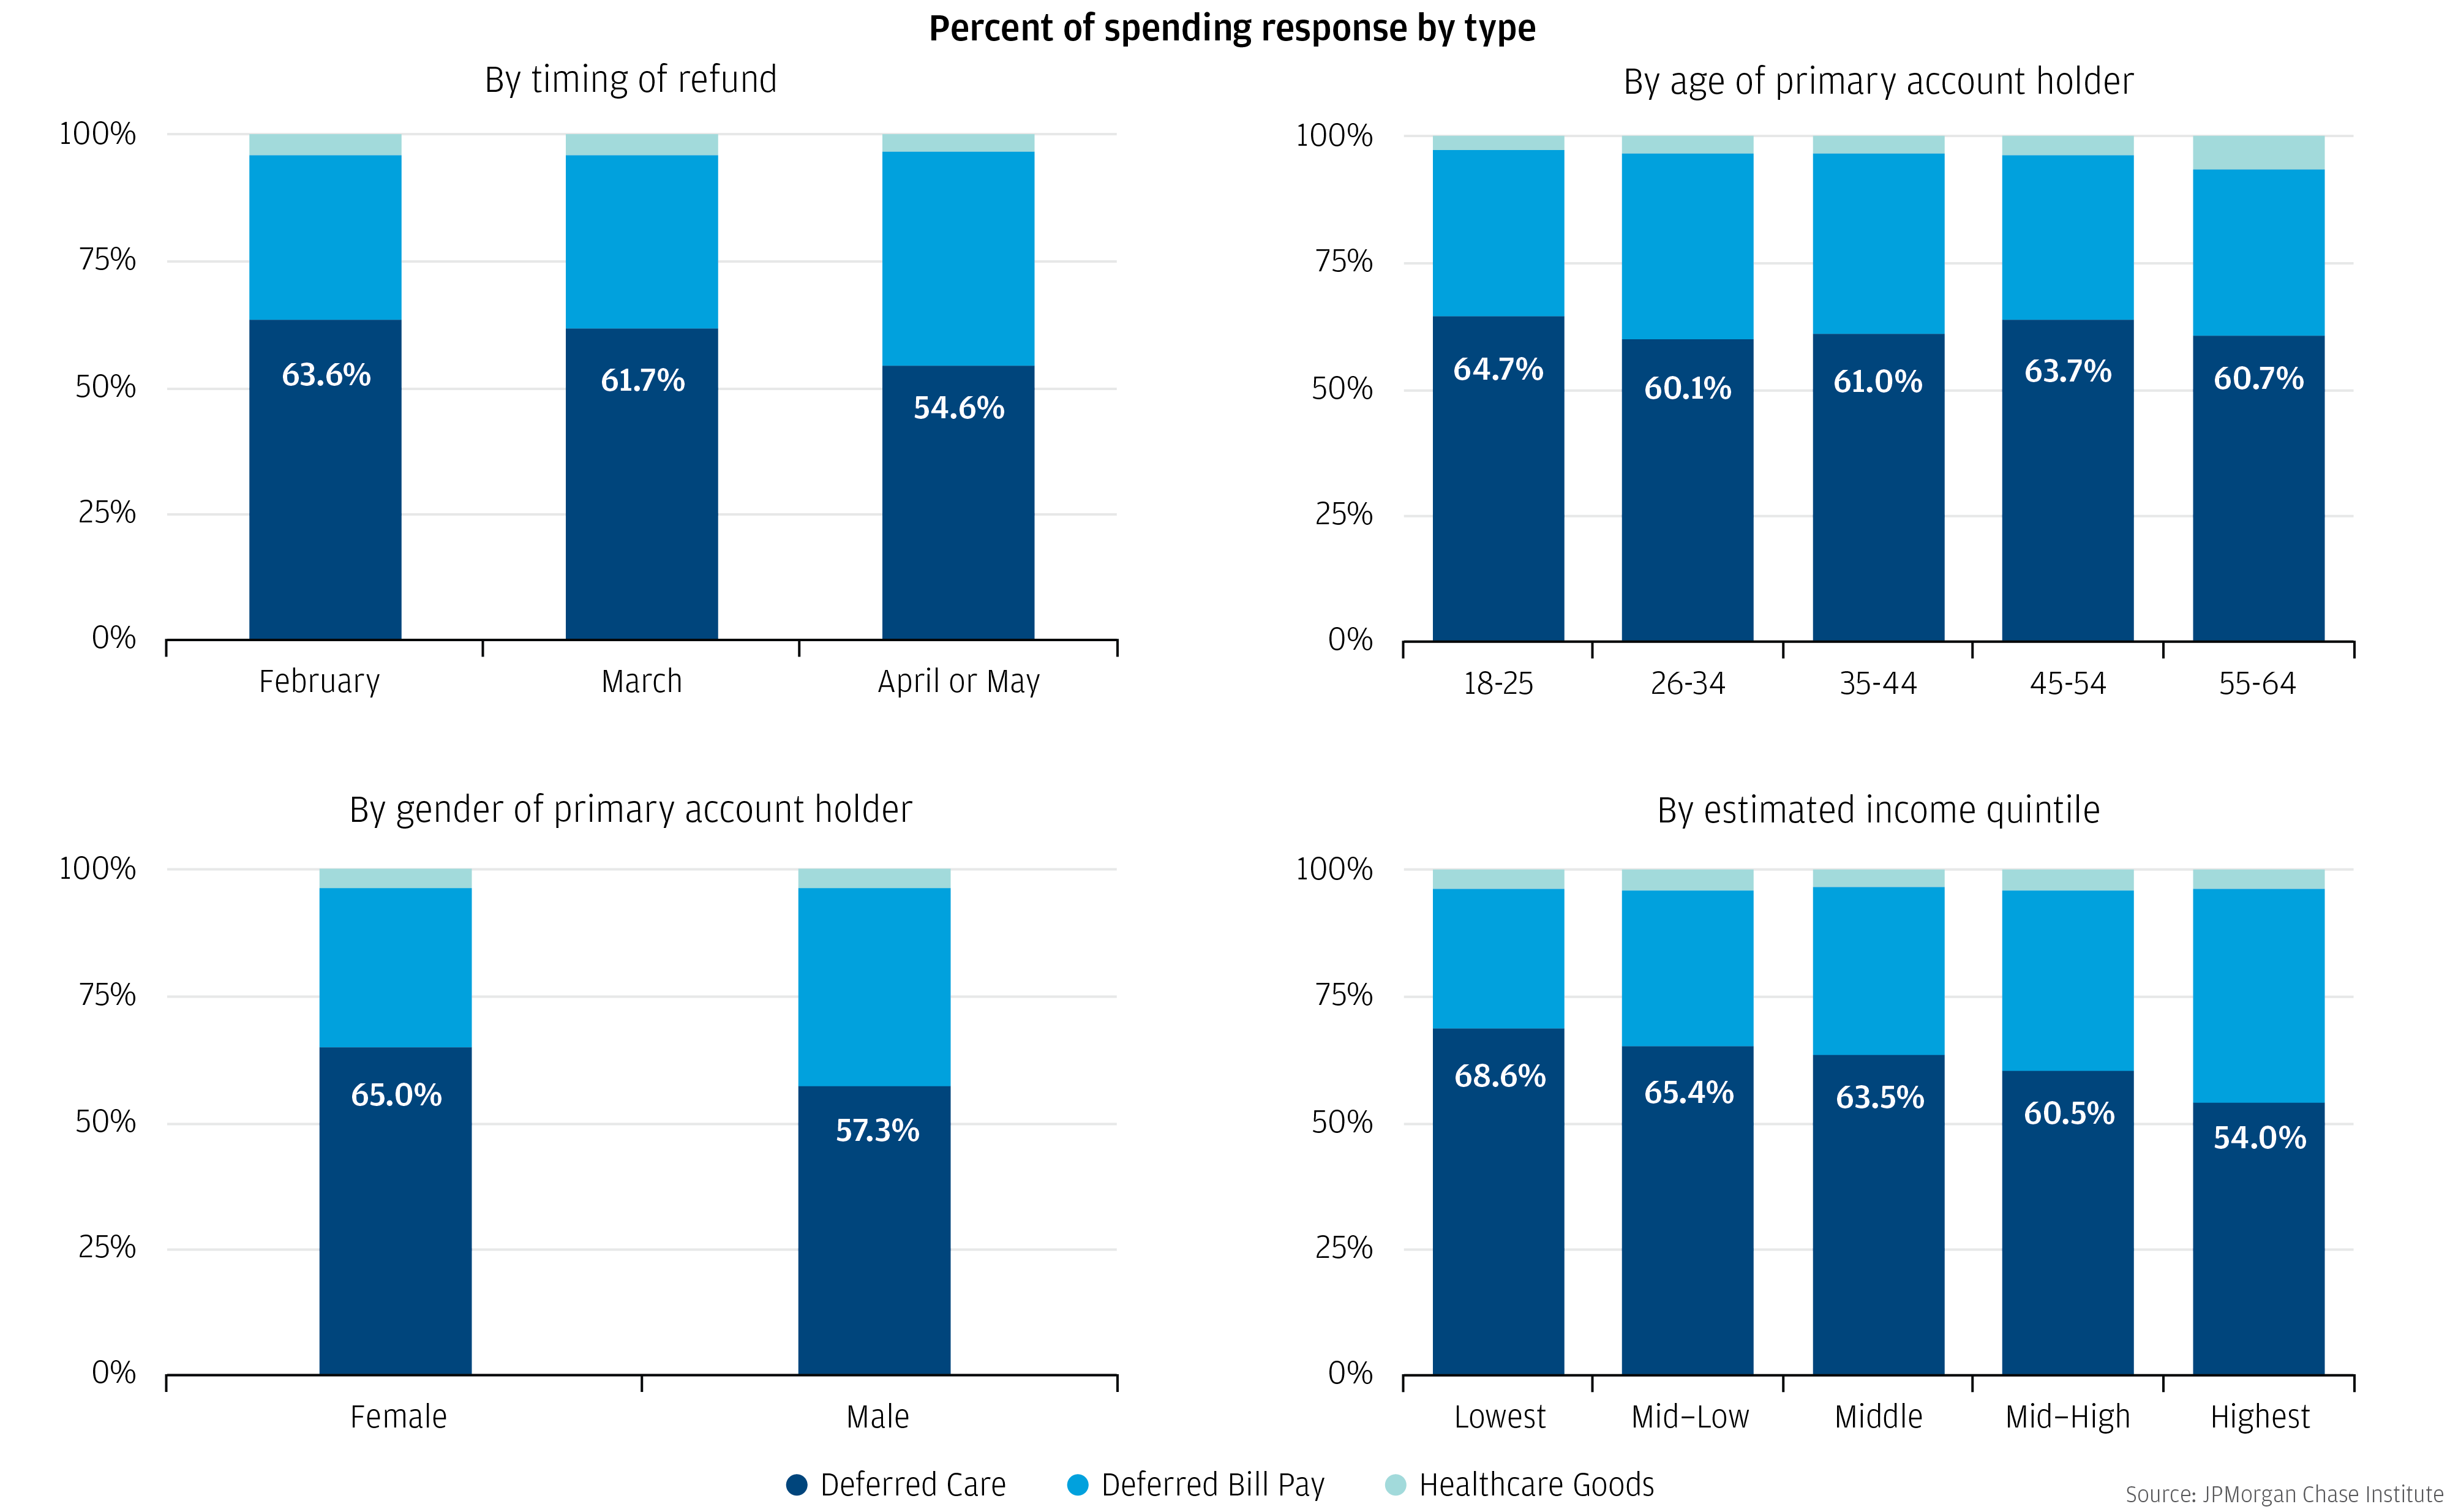
One way to evaluate the magnitude of the healthcare spending response to tax refunds is with the fraction by which spending jumped when the tax refund arrived. This provides a view into the fraction of healthcare spending which had been deferred during the pre-refund period. In Figure 5, we show these magnitudes for earlier versus later filers (top left panel), by age (top right) and gender (bottom left) of primary account holder, and by estimated income quintile (bottom right). We see substantial gradients in all cases. For example, the earliest filers responded more sharply to the tax refund (38 percent increase over a typical 76 day period during the pre-refund baseline) compared with the later filers (22.2 percent), who in turn responded more sharply than the latest filers (11.5 percent).
In previous research, we showed that levels of annual overall spending were lowest among younger account holders and lower income people. However, Figure 5 shows that these groups deferred a larger fraction of their annual healthcare spending until they received their tax refund. For example, among the lowest-income accounts, spending is elevated by 29.6 percent in the 76 days after the tax refund, relative to the 76 day period prior to the refund. This implies that almost a quarter (29.6 percent refund response / 129.6 percent of spending in the baseline period) of these consumers’ overall spending over those 76 days had been deferred from the pre-refund period.
Figure 5: There were steep socioeconomic and demographic gradients in deferred healthcare spending
In Figure 6, we decompose the spending response to the tax refund into deferred care (in-person payments at healthcare service providers), deferred bill pay (remote payments to healthcare service providers), and payments to providers of drugs and other healthcare goods that can be stockpiled. Almost 64 percent of the spending response from accounts held by the earliest filers represented deferred care, compared to just over 54 percent from accounts held by the latest filers. The fraction of the spending response that was deferred care did not vary significantly with the age of the primary account holder. Sixty-five percent of the response from accounts held by women represented deferred care, compared with only 57 percent from accounts held by men. We also see a significant income gradient in the fraction of the spending response that represented deferred care (bottom right — 68.6 percent among the lowest-income quintile, compared with 54 percent among the highest-income quintile).
Figure 6: Deferred care represented a larger fraction of deferred healthcare spending out of accounts held by earlier filers, women, and lower-income people
The patterns in Figures 5 and 6 highlight significant and important socioeconomic variation in the fraction of care that is deferred until a major cash flow event. But deferred spending and deferred care are not only low-income phenomena. Notwithstanding the income gradients in the proportional spending response to the tax refund, we next show that cash flow dynamics influenced the timing of spending even for higher-income quintiles.
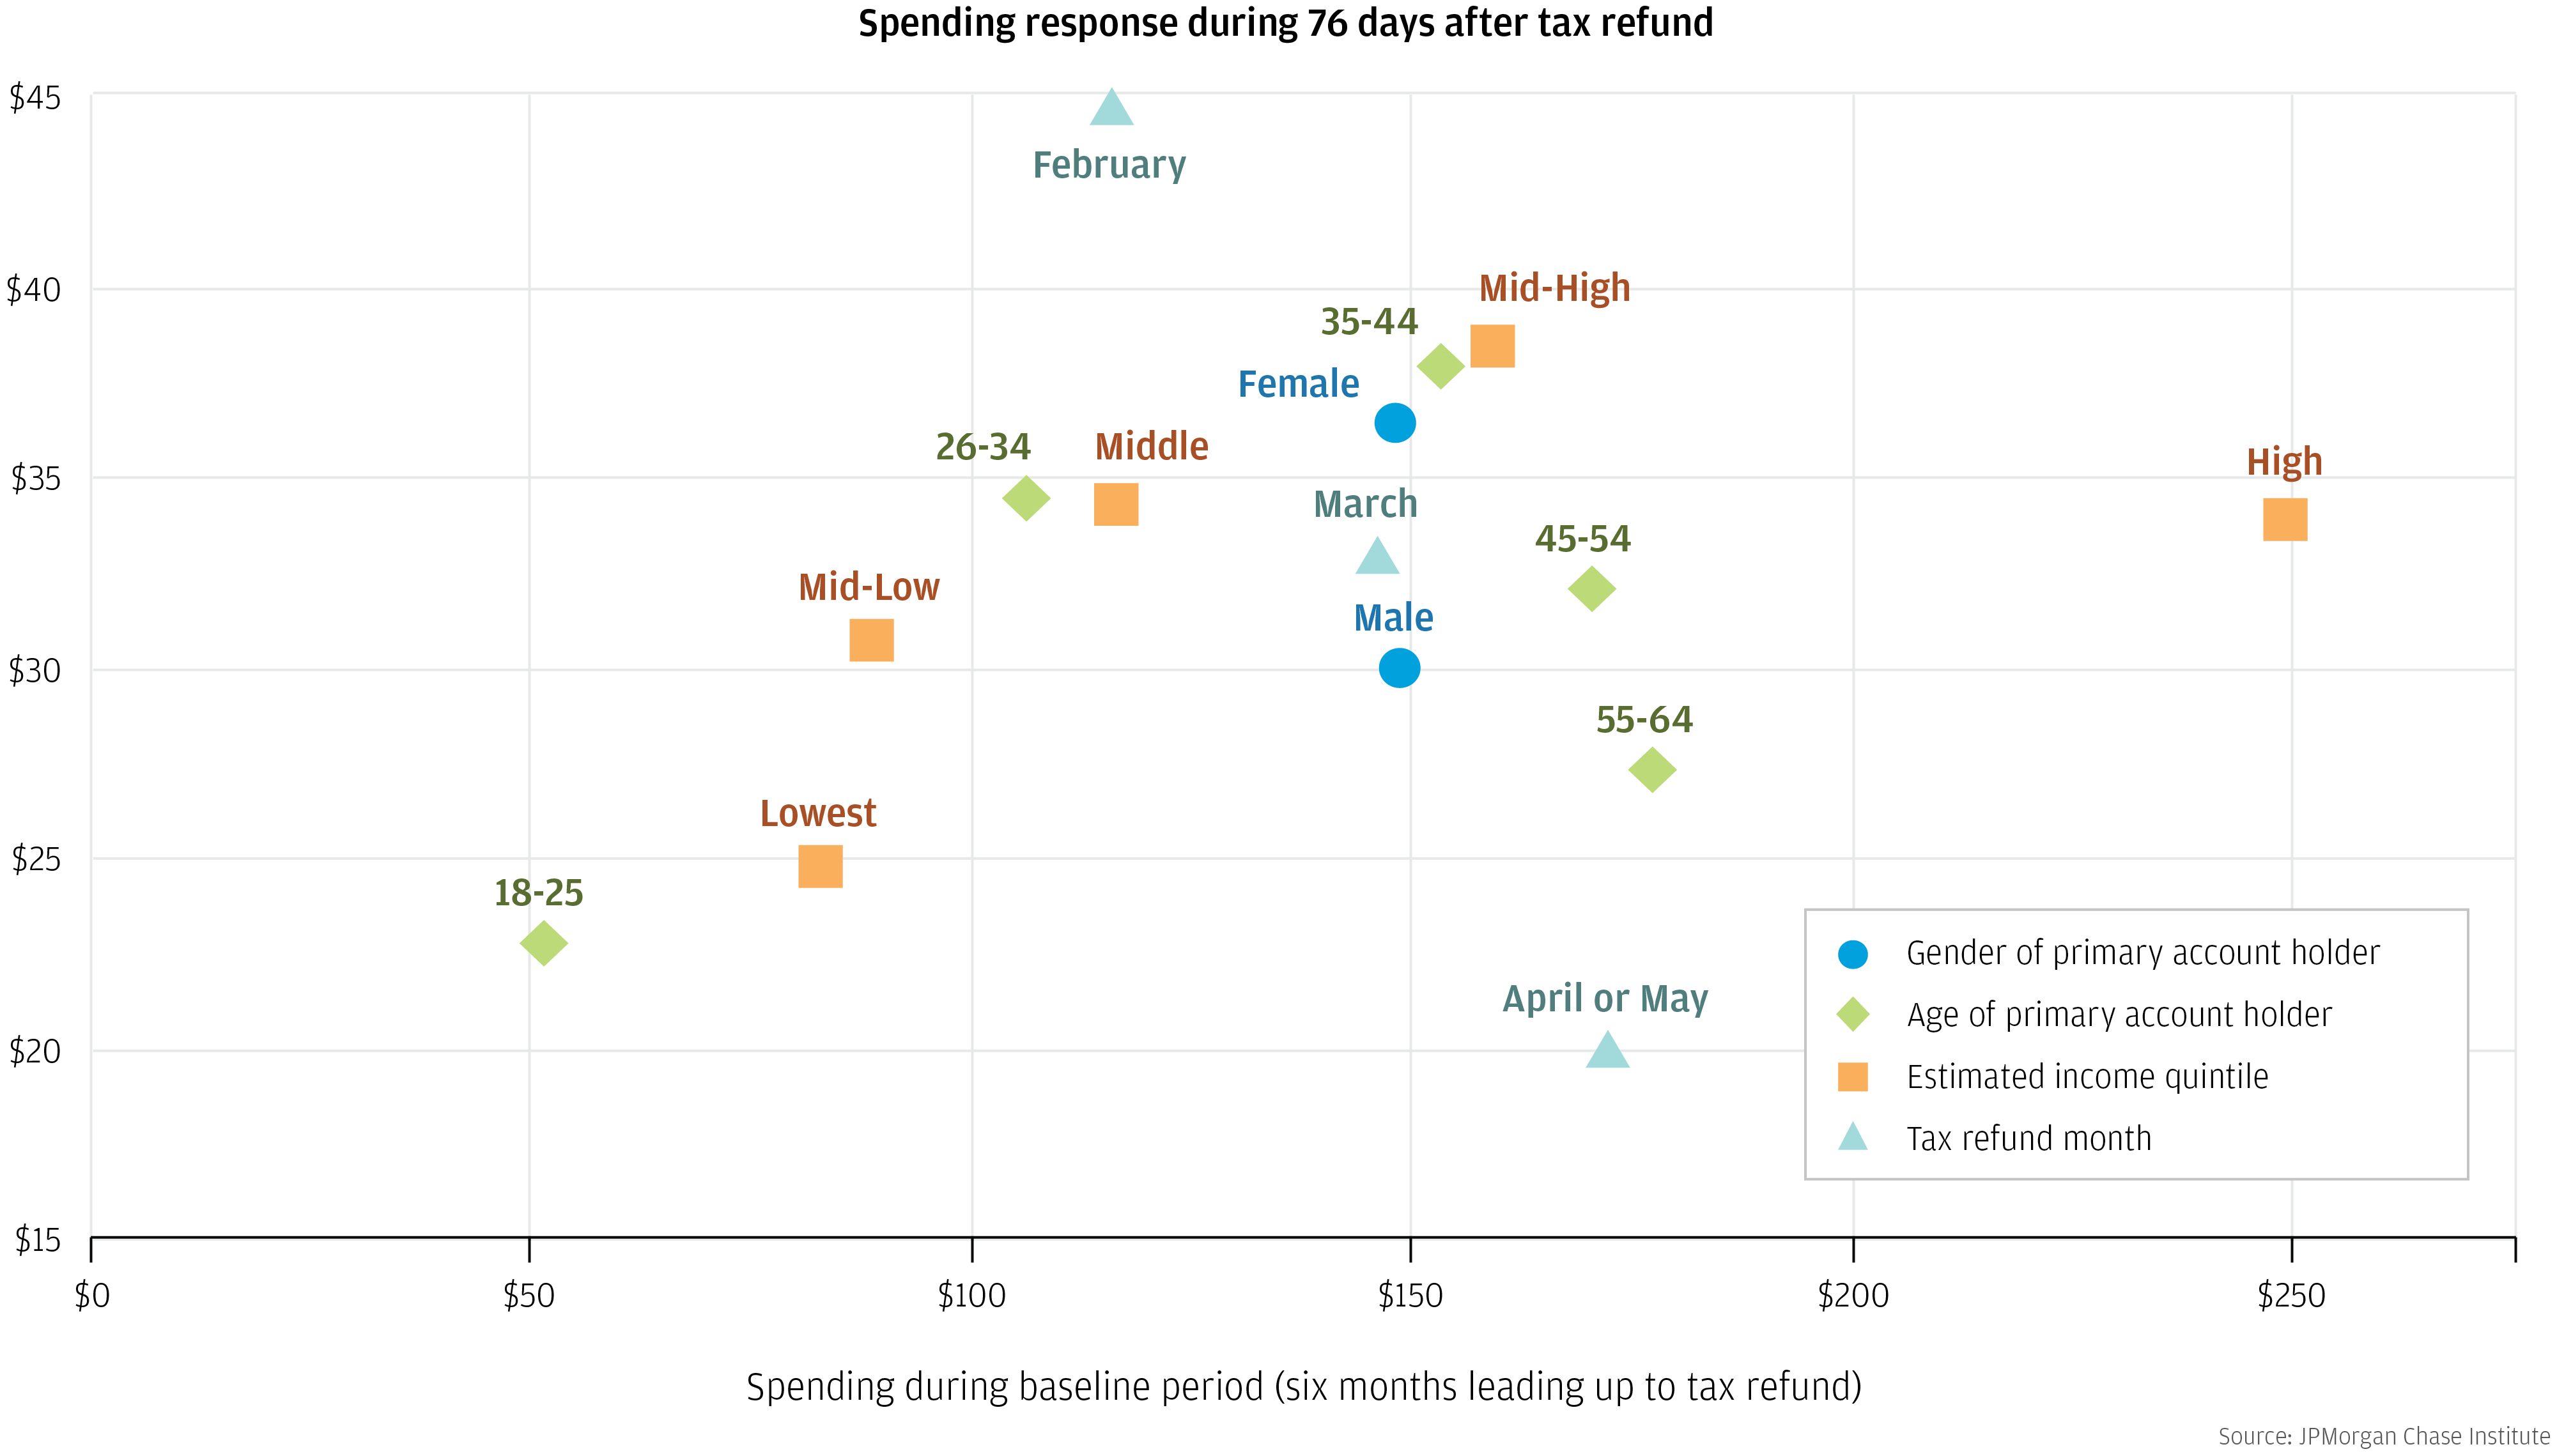
In Figure 5, we showed that lower-income account holders increased overall spending by a larger proportion in response to the tax refund. Could this reflect the fact that those who spend more outside of tax season defer less of their spending until the refund arrives? In Figure 7, we show that the story is not so simple — in fact, spending spiked the most in dollar terms among many of the groups who were already spending the most outside of refund season.
Figure 7: After a tax refund, spending spiked the most in dollar terms among many groups who were already spending the most outside of refund season
Figure 7 relates spending during the pre-refund period to the size of the spending response in absolute dollar terms. As income increases, spending prior to the refund increases, but so does the spending response. This does not simply mean that income groups who spent the most after receiving their refunds were the ones who had already been spending the most before. Rather, what Figure 7 shows is that spending tended to spike after the refund in dollar terms even among higher-income account holders, who likely have more scope to smooth their consumption with savings or credit (The illustrative exception is the top income quintile, who spent the most during the pre-refund period and did not increase their spending as much in response to the refund). Contrast this with the pattern by timing of the refund; those who received their refunds earliest in the season spent the least outside of refund season, and then increased their spending the most when the refund arrived. Most generally, the patterns in Figure 7 indicate that spending more on healthcare during the pre-refund period does not necessarily reduce the amount of spending that is deferred until the refund arrives.
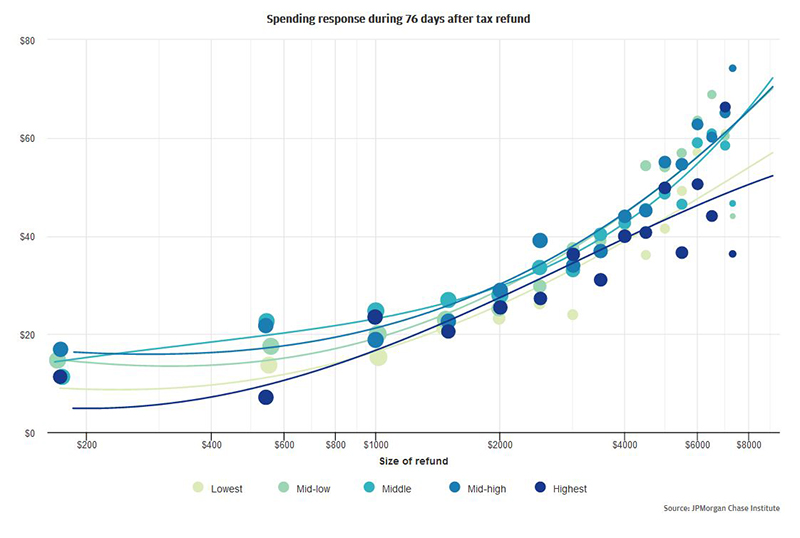
A pattern illustrated in Figure 4, however, is that those who were spending the most during the baseline period (middle-aged and higher-income account holders) also received the largest average tax refunds. Therefore, the same dollar spending response represents a smaller fraction of the tax refund for higher-income recipients than for lower-income recipients. Could differences in refund size be driving the pattern shown in Figure 7? In Figure 8, we show that differences in the spending responses across the income distribution are not just an artifact of higher-income accounts receiving larger refunds. We examine the relationship between the dollar size of the refund and the dollar increase in spending that it triggered, separately by income quintile.8 There are two main insights to draw from this graph:
Figure 8: The relationship between size of tax refund & spending spikes is similar across the income distribution
Both of these patterns raise important questions about pent-up demand for healthcare services when the refund arrives and about the marginal propensity to spend tax refund dollars to cover out-of-pocket healthcare costs. For example, one might expect that lower-income account holders would have more pent-up demand for healthcare when the refund arrives, and so they may increase their spending than a higher-income account holder who received the same size refund, but Figures 7 and 8 show that is not the case. More generally, all of the patterns here and in our previous research indicate that the marginal propensity to spend tax refund dollars on healthcare is likely to be substantial, but Figure 8 suggests that this marginal propensity might not vary much across the income distribution.9
Taken together, these patterns suggest that cash flow dynamics affect consumption of healthcare across most or all of the income distribution, and not only among the lower-income. Even though the lowest income groups deferred a larger proportion of their out-of-pocket healthcare spending until the tax refund arrived (Figure 5), all income quintiles responded to the cash infusion from the tax refund (Figure 7), and the spending response in dollar terms that is associated with dollars received in the tax refund is consistent across the income distribution (Figure 8).
However, as we discuss in the next section, it turns out that we do see evidence of variation in pent-up demand for healthcare during refund season. It’s just that we see this variation across self-selected filing groups, rather than income quintiles.
In Figures 3 and 4, we saw patterns consistent with the hypothesis that, whether consciously or not, consumers use tax filing to generate a cash infusion amassed from “deferred income.” In Figures 5 and 6, we saw evidence that one of the uses to which consumers put that cash infusion is to cover deferred out-of-pocket healthcare spending.
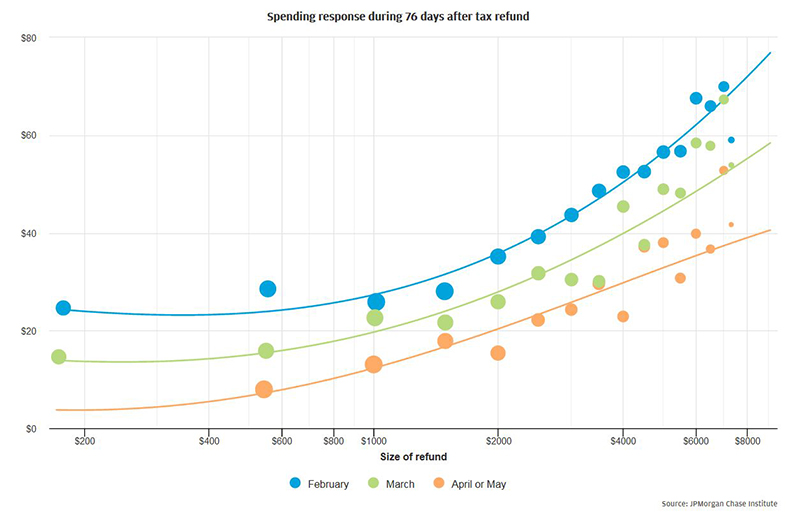
In Figure 9, we repeat the analysis shown in Figure 8, but differentiate accounts based on the timing when the refund arrived rather than by estimated income quintile. In contrast to our findings from the income stratification, we observe that for any fixed refund amount, the spending spike was larger for earlier filers (vertical positions of curves and dots); additionally, there was a clear gradient in the association between size of refund and additional spending response (slopes of curves).10 The difference in spending associated with differences in refund size was greater among those who received their refunds in February than for those who received their refunds in April or May.
Figure 9: Earlier filers spent a larger fraction of their refund on healthcare
Taken together, these patterns suggest that those who file earlier in the season may have a higher marginal propensity to spend tax refund dollars to cover out-of-pocket healthcare costs. Furthermore, this would imply that deferred healthcare spending is directly or indirectly related to consumers’ decisions regarding when to file.11
The fact that we observe evidence of a difference in the impact of a tax refund dollar across self-selected filing groups, but not across estimated income quintiles, suggests that consumers’ decisions about when to file may reflect their pent-up healthcare spending needs more directly than their income does.12 This is further borne out by the fact that all the patterns in Figure 9 hold even when we compare across tax filing groups within an estimated income quintile.
Beneath the overall average impact of cash flow dynamics on healthcare spending, there are sharp gradients across demographic and socioeconomic groups. A larger fraction of the care paid for out-of-pocket by early filers, younger people, women, and lower-income people was deferred until a significant positive cash flow event. At the same time, cash flow dynamics affect the timing of out-of-pocket healthcare spending across the income distribution; even within an income group, those for whom cash flow is a more powerful driver file earlier. The 38 percent of tax filers who filed early enough to receive their refunds in February spent a larger fraction of their refunds on out-of-pocket healthcare costs, including deferred care. This raises important questions for policy and research:
Is it time to revisit periodic disbursements of refundable tax credits? For some lower-income families, refund size may be driven by refundable tax credits like the Earned Income Tax Credit, and periodic refund payments are generally not available as an option. In these cases, deferring income until tax season is a direct consequence of the way that tax policy is structured and tax refunds are disbursed. This raises two important policy questions. One is whether periodic payments would reduce the deferral of healthcare outside of refund season. This is an important empirical question; would a sequence of small payments enable the same sort of spending as one large sum? The second policy question is whether there might be a way to increase the flexibility in the timing when the lump sum becomes available. Healthcare and other spending needs may arise outside of the months of February and March; fixing one of the largest cash flow events of the year to only this time frame virtually guarantees that some will have to defer care.
Are there ways to let families tap into their excess payroll withholdings when they need them? For higher-income groups, for whom deferred income — the amount of their tax refund — is more likely to be driven primarily by payroll withholding, the impact of tax refunds on the timing of healthcare payments is even more striking. Even in the higher-income quintiles, those who are owed larger refunds tend to file sooner. This suggests that they may be aware that they are overpaying throughout the year. More generally, the patterns we observe here indicate that whether deliberately or not, there is a significant fraction of consumers even in the middle of the income distribution for whom the tax system functions as a zero interest rate savings vehicle. An important question this raises is whether it would be possible to provide an alternative savings vehicle that shares some features of tax withholding — for example, built-in commitment and “set it and forget it” transparency to the consumer — but in which the consumer has more direct control over the timing when the lump sum becomes available and has the opportunity to earn some interest in the meantime. This type of vehicle, such as employer-sponsored sidecar savings accounts, would allow consumers to provision against the risk of a larger than expected tax bill, and also against other risks that they might encounter outside of tax refund season.
Farrell, Diana, Fiona Greig and Amar Hamoudi “Filing Taxes Early, Getting Healthcare Late: Insights from 1.2 million households” JPMorgan Chase Institute, 2018.
The time path represented in figure 2 is adjusted to remove noise generated by two effects: first, healthcare spending is naturally lower on weekends and holidays compared with standard weekdays, and second, tax refunds are never credited on weekends. As a result, day 0 is a weekday for all 1.2 million accounts in our sample, which therefore means that days 0 ± 7, 0 ± 14, and so on also fall on weekdays for 100 percent of the sample. By contrast, for example, days 4 ± 7, 4 ± 14, and so on fall on weekends for 48 percent of the sample. This creates noise in the time series, which we sweep out by estimating a regression of healthcare spending on each account-day during the pre-refund baseline period against:
We then compute the residual from this regression (that is, variation that is left over after accounting for these calendar effects), and add that back to the pre-refund baseline average to generate the time series shown in figure 2.
Our findings indicate that timing of filing likely reflects a host of unobserved characteristics related to healthcare spending needs. One important set of potential characteristics is family composition. Our data provide a clearer lens on account holders’ incomes than on their marital/partnership status, the number and ages of any children they might be caring for, and so on. Family size certainly correlates with healthcare spending needs and with total take-home income. Therefore, one possible simple explanation for the differences between figures 8 and 9 might have been that in figure 8 we are in part comparing larger families in higher income quintiles with smaller families in lower income quintiles. However, when we pull out only accounts that are very likely to be held by single householders, we observe all the same patterns reported here. Therefore, it is unlikely that unobserved family composition is a complete simple explanation for the differences between figures 8 and 9.


JPMorgan Chase & Co.'s website terms, privacy and security policies don't apply to the site or app you're about to visit. Please review its website terms, privacy and security policies to see how they apply to you. JPMorgan Chase & Co. isn't responsible for (and doesn't provide) any products, services or content at this third-party site or app, except for products and services that explicitly carry the JPMorgan Chase & Co.